JOTUN A/S
78
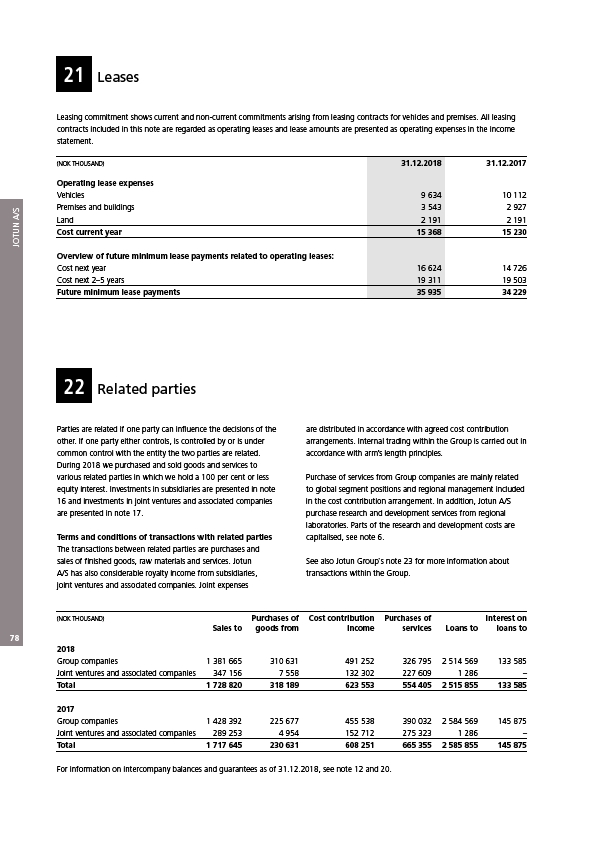
Leases
Leasing commitment shows current and non-current commitments arising from leasing contracts for vehicles and premises. All leasing
contracts included in this note are regarded as operating leases and lease amounts are presented as operating expenses in the income
statement.
(NOK THOUSAND) 31.12.2018 31.12.2017
Operating lease expenses
Vehicles 9 634 10 112
Premises and buildings 3 543 2 927
Land 2 191 2 191
Cost current year 15 368 15 230
Overview of future minimum lease payments related to operating leases:
Cost next year 16 624 14 726
Cost next 2–5 years 19 311 19 503
Future minimum lease payments 35 935 34 229
Related parties
21
22
Parties are related if one party can influence the decisions of the
other. If one party either controls, is controlled by or is under
common control with the entity the two parties are related.
During 2018 we purchased and sold goods and services to
various related parties in which we hold a 100 per cent or less
equity interest. Investments in subsidiaries are presented in note
16 and investments in joint ventures and associated companies
are presented in note 17.
Terms and conditions of transactions with related parties
The transactions between related parties are purchases and
sales of finished goods, raw materials and services. Jotun
A/S has also considerable royalty income from subsidiaries,
joint ventures and associated companies. Joint expenses
are distributed in accordance with agreed cost contribution
arrangements. Internal trading within the Group is carried out in
accordance with arm’s length principles.
Purchase of services from Group companies are mainly related
to global segment positions and regional management included
in the cost contribution arrangement. In addition, Jotun A/S
purchase research and development services from regional
laboratories. Parts of the research and development costs are
capitalised, see note 6.
See also Jotun Group`s note 23 for more information about
transactions within the Group.
(NOK THOUSAND) Purchases of Cost contribution Purchases of Interest on
Sales to goods from income services Loans to loans to
2018
Group companies 1 381 665 310 631 491 252 326 795 2 514 569 133 585
Joint ventures and associated companies 347 156 7 558 132 302 227 609 1 286 –
Total 1 728 820 318 189 623 553 554 405 2 515 855 133 585
2017
Group companies 1 428 392 225 677 455 538 390 032 2 584 569 145 875
Joint ventures and associated companies 289 253 4 954 152 712 275 323 1 286 –
Total 1 717 645 230 631 608 251 665 355 2 585 855 145 875
For information on intercompany balances and guarantees as of 31.12.2018, see note 12 and 20.