JOTUN GROUP
29
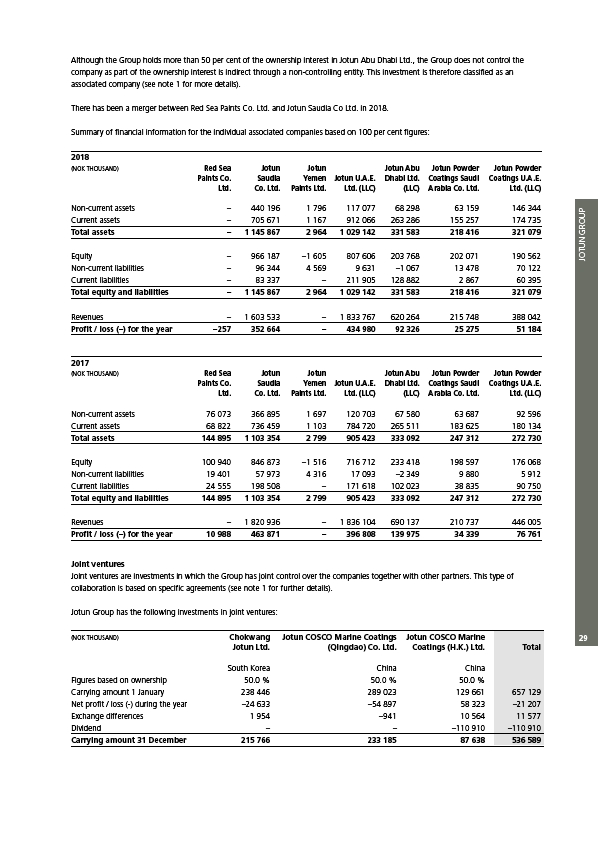
Although the Group holds more than 50 per cent of the ownership interest in Jotun Abu Dhabi Ltd., the Group does not control the
company as part of the ownership interest is indirect through a non-controlling entity. This investment is therefore classified as an
associated company (see note 1 for more details).
There has been a merger between Red Sea Paints Co. Ltd. and Jotun Saudia Co Ltd. in 2018.
Summary of financial information for the individual associated companies based on 100 per cent figures:
2018
(NOK THOUSAND) Red Sea Jotun Jotun Jotun Abu Jotun Powder Jotun Powder
Paints Co. Saudia Yemen Jotun U.A.E. Dhabi Ltd. Coatings Saudi Coatings U.A.E.
Ltd. Co. Ltd. Paints Ltd. Ltd. (LLC) (LLC) Arabia Co. Ltd. Ltd. (LLC)
Non-current assets – 440 196 1 796 117 077 68 298 63 159 146 344
Current assets – 705 671 1 167 912 066 263 286 155 257 174 735
Total assets – 1 145 867 2 964 1 029 142 331 583 218 416 321 079
Equity – 966 187 –1 605 807 606 203 768 202 071 190 562
Non-current liabilities – 96 344 4 569 9 631 –1 067 13 478 70 122
Current liabilities – 83 337 – 211 905 128 882 2 867 60 395
Total equity and liabilities – 1 145 867 2 964 1 029 142 331 583 218 416 321 079
Revenues – 1 603 533 – 1 833 767 620 264 215 748 388 042
Profit / loss (–) for the year –257 352 664 – 434 980 92 326 25 275 51 184
2017
(NOK THOUSAND) Red Sea Jotun Jotun Jotun Abu Jotun Powder Jotun Powder
Paints Co. Saudia Yemen Jotun U.A.E. Dhabi Ltd. Coatings Saudi Coatings U.A.E.
Ltd. Co. Ltd. Paints Ltd. Ltd. (LLC) (LLC) Arabia Co. Ltd. Ltd. (LLC)
Non-current assets 76 073 366 895 1 697 120 703 67 580 63 687 92 596
Current assets 68 822 736 459 1 103 784 720 265 511 183 625 180 134
Total assets 144 895 1 103 354 2 799 905 423 333 092 247 312 272 730
Equity 100 940 846 873 –1 516 716 712 233 418 198 597 176 068
Non-current liabilities 19 401 57 973 4 316 17 093 –2 349 9 880 5 912
Current liabilities 24 555 198 508 – 171 618 102 023 38 835 90 750
Total equity and liabilities 144 895 1 103 354 2 799 905 423 333 092 247 312 272 730
Revenues – 1 820 936 – 1 836 104 690 137 210 737 446 005
Profit / loss (–) for the year 10 988 463 871 – 396 808 139 975 34 339 76 761
Joint ventures
Joint ventures are investments in which the Group has joint control over the companies together with other partners. This type of
collaboration is based on specific agreements (see note 1 for further details).
Jotun Group has the following investments in joint ventures:
(NOK THOUSAND) Chokwang Jotun COSCO Marine Coatings Jotun COSCO Marine
Jotun Ltd. (Qingdao) Co. Ltd. Coatings (H.K.) Ltd. Total
South Korea China China
Figures based on ownership 50.0 % 50.0 % 50.0 %
Carrying amount 1 January 238 446 289 023 129 661 657 129
Net profit / loss (-) during the year –24 633 –54 897 58 323 –21 207
Exchange differences 1 954 –941 10 564 11 577
Dividend – – –110 910 –110 910
Carrying amount 31 December 215 766 233 185 87 638 536 589