JOTUN A/S
57
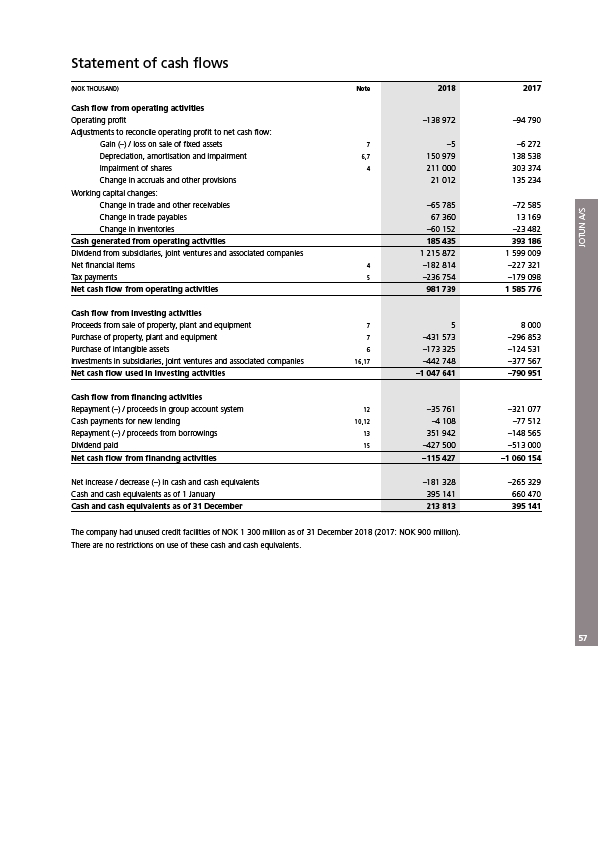
Statement of cash flows
(NOK THOUSAND) Note 2018 2017
Cash flow from operating activities
Operating profit –138 972 –94 790
Adjustments to reconcile operating profit to net cash flow:
Gain (–) / loss on sale of fixed assets 7 –5 –6 272
Depreciation, amortisation and impairment 6,7 150 979 138 538
Impairment of shares 4 211 000 303 374
Change in accruals and other provisions 21 012 135 234
Working capital changes:
Change in trade and other receivables –65 785 –72 585
Change in trade payables 67 360 13 169
Change in inventories –60 152 –23 482
Cash generated from operating activities 185 435 393 186
Dividend from subsidiaries, joint ventures and associated companies 1 215 872 1 599 009
Net financial items 4 –182 814 –227 321
Tax payments 5 –236 754 –179 098
Net cash flow from operating activities 981 739 1 585 776
Cash flow from investing activities
Proceeds from sale of property, plant and equipment 7 5 8 000
Purchase of property, plant and equipment 7 –431 573 –296 853
Purchase of intangible assets 6 –173 325 –124 531
Investments in subsidiaries, joint ventures and associated companies 16,17 –442 748 –377 567
Net cash flow used in investing activities –1 047 641 –790 951
Cash flow from financing activities
Repayment (–) / proceeds in group account system 12 –35 761 –321 077
Cash payments for new lending 10,12 –4 108 –77 512
Repayment (–) / proceeds from borrowings 13 351 942 –148 565
Dividend paid 15 –427 500 –513 000
Net cash flow from financing activities –115 427 –1 060 154
Net increase / decrease (–) in cash and cash equivalents –181 328 –265 329
Cash and cash equivalents as of 1 January 395 141 660 470
Cash and cash equivalents as of 31 December 213 813 395 141
The company had unused credit facilities of NOK 1 300 million as of 31 December 2018 (2017: NOK 900 million).
There are no restrictions on use of these cash and cash equivalents.