JOTUN GROUP
42
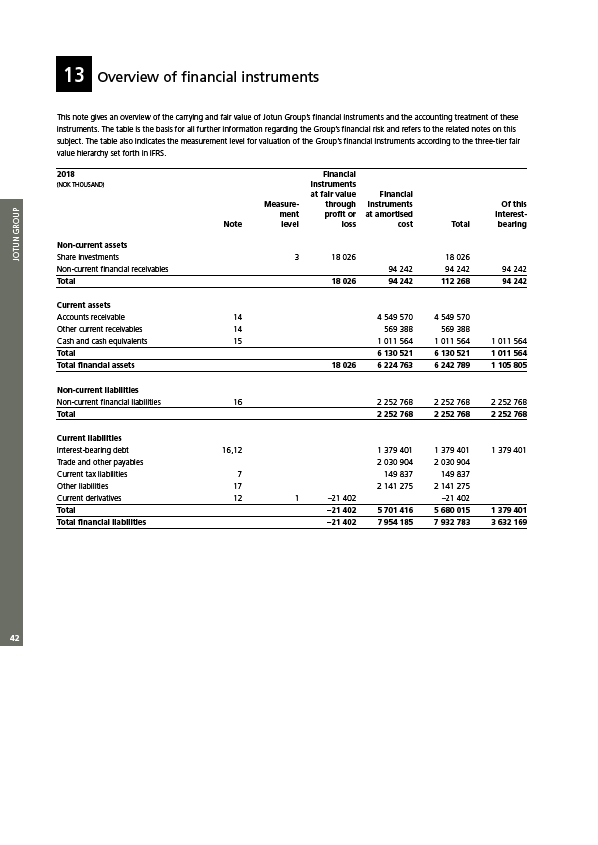
13 Overview of financial instruments
This note gives an overview of the carrying and fair value of Jotun Group’s financial instruments and the accounting treatment of these
instruments. The table is the basis for all further information regarding the Group’s financial risk and refers to the related notes on this
subject. The table also indicates the measurement level for valuation of the Group’s financial instruments according to the three-tier fair
value hierarchy set forth in IFRS.
2018 Financial
(NOK THOUSAND) instruments
at fair value Financial
Measure- through instruments Of this
ment profit or at amortised interest-
Note level loss cost Total bearing
Non-current assets
Share investments 3 18 026 18 026
Non-current financial receivables 94 242 94 242 94 242
Total 18 026 94 242 112 268 94 242
Current assets
Accounts receivable 14 4 549 570 4 549 570
Other current receivables 14 569 388 569 388
Cash and cash equivalents 15 1 011 564 1 011 564 1 011 564
Total 6 130 521 6 130 521 1 011 564
Total financial assets 18 026 6 224 763 6 242 789 1 105 805
Non-current liabilities
Non-current financial liabilities 16 2 252 768 2 252 768 2 252 768
Total 2 252 768 2 252 768 2 252 768
Current liabilities
Interest-bearing debt 16,12 1 379 401 1 379 401 1 379 401
Trade and other payables 2 030 904 2 030 904
Current tax liabilities 7 149 837 149 837
Other liabilities 17 2 141 275 2 141 275
Current derivatives 12 1 –21 402 –21 402
Total –21 402 5 701 416 5 680 015 1 379 401
Total financial liabilities –21 402 7 954 185 7 932 783 3 632 169