JOTUN GROUP
33
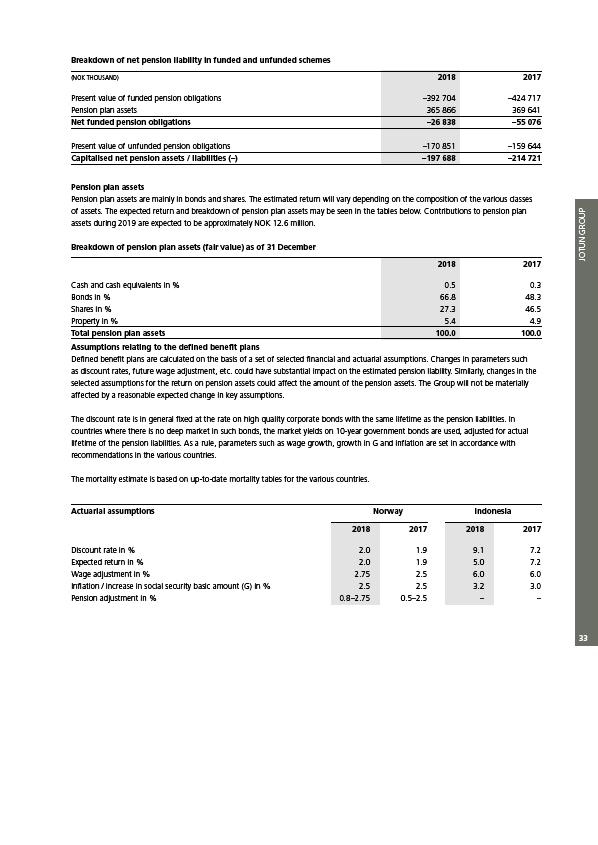
Breakdown of net pension liability in funded and unfunded schemes
(NOK THOUSAND) 2018 2017
Present value of funded pension obligations –392 704 –424 717
Pension plan assets 365 866 369 641
Net funded pension obligations –26 838 –55 076
Present value of unfunded pension obligations –170 851 –159 644
Capitalised net pension assets / liabilities (–) –197 688 –214 721
Pension plan assets
Pension plan assets are mainly in bonds and shares. The estimated return will vary depending on the composition of the various classes
of assets. The expected return and breakdown of pension plan assets may be seen in the tables below. Contributions to pension plan
assets during 2019 are expected to be approximately NOK 12.6 million.
Breakdown of pension plan assets (fair value) as of 31 December
2018 2017
Cash and cash equivalents in % 0.5 0.3
Bonds in % 66.8 48.3
Shares in % 27.3 46.5
Property in % 5.4 4.9
Total pension plan assets 100.0 100.0
Assumptions relating to the defined benefit plans
Defined benefit plans are calculated on the basis of a set of selected financial and actuarial assumptions. Changes in parameters such
as discount rates, future wage adjustment, etc. could have substantial impact on the estimated pension liability. Similarly, changes in the
selected assumptions for the return on pension assets could affect the amount of the pension assets. The Group will not be materially
affected by a reasonable expected change in key assumptions.
The discount rate is in general fixed at the rate on high quality corporate bonds with the same lifetime as the pension liabilities. In
countries where there is no deep market in such bonds, the market yields on 10-year government bonds are used, adjusted for actual
lifetime of the pension liabilities. As a rule, parameters such as wage growth, growth in G and inflation are set in accordance with
recommendations in the various countries.
The mortality estimate is based on up-to-date mortality tables for the various countries.
Norway Indonesia
Actuarial assumptions
2018 2017 2018 2017
Discount rate in % 2.0 1.9 9.1 7.2
Expected return in % 2.0 1.9 5.0 7.2
Wage adjustment in % 2.75 2.5 6.0 6.0
Inflation / increase in social security basic amount (G) in % 2.5 2.5 3.2 3.0
Pension adjustment in % 0.8–2.75 0.5–2.5 – –