JOTUN GROUP
28
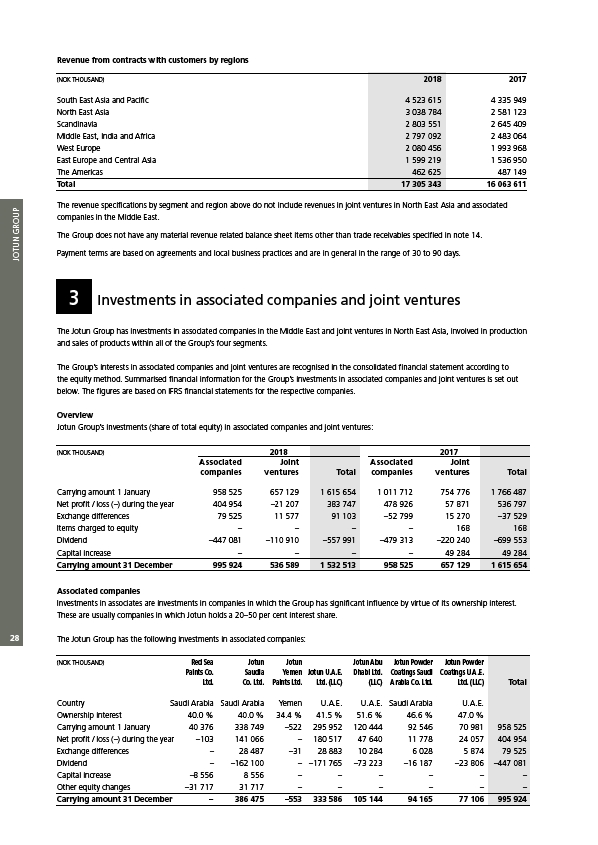
Revenue from contracts with customers by regions
(NOK THOUSAND) 2018 2017
South East Asia and Pacific 4 523 615 4 335 949
North East Asia 3 038 784 2 581 123
Scandinavia 2 803 551 2 645 409
Middle East, India and Africa 2 797 092 2 483 064
West Europe 2 080 456 1 993 968
East Europe and Central Asia 1 599 219 1 536 950
The Americas 462 625 487 149
Total 17 305 343 16 063 611
The revenue specifications by segment and region above do not include revenues in joint ventures in North East Asia and associated
companies in the Middle East.
The Group does not have any material revenue related balance sheet items other than trade receivables specified in note 14.
Payment terms are based on agreements and local business practices and are in general in the range of 30 to 90 days.
3 Investments in associated companies and joint ventures
The Jotun Group has investments in associated companies in the Middle East and joint ventures in North East Asia, involved in production
and sales of products within all of the Group’s four segments.
The Group’s interests in associated companies and joint ventures are recognised in the consolidated financial statement according to
the equity method. Summarised financial information for the Group’s investments in associated companies and joint ventures is set out
below. The figures are based on IFRS financial statements for the respective companies.
Overview
Jotun Group’s investments (share of total equity) in associated companies and joint ventures:
(NOK THOUSAND) 2018
2017
Associated Joint Associated Joint
companies ventures Total companies ventures Total
Carrying amount 1 January 958 525 657 129 1 615 654 1 011 712 754 776 1 766 487
Net profit / loss (–) during the year 404 954 –21 207 383 747 478 926 57 871 536 797
Exchange differences 79 525 11 577 91 103 –52 799 15 270 –37 529
Items charged to equity – – – – 168 168
Dividend –447 081 –110 910 –557 991 –479 313 –220 240 –699 553
Capital increase – – – – 49 284 49 284
Carrying amount 31 December 995 924 536 589 1 532 513 958 525 657 129 1 615 654
Associated companies
Investments in associates are investments in companies in which the Group has significant influence by virtue of its ownership interest.
These are usually companies in which Jotun holds a 20–50 per cent interest share.
The Jotun Group has the following investments in associated companies:
(NOK THOUSAND) Red Sea Jotun Jotun Jotun Abu Jotun Powder Jotun Powder
Paints Co. Saudia Yemen Jotun U.A.E. Dhabi Ltd. Coatings Saudi Coatings U.A.E.
Ltd. Co. Ltd. Paints Ltd. Ltd. (LLC) (LLC) Arabia Co. Ltd. Ltd. (LLC) Total
Country Saudi Arabia Saudi Arabia Yemen U.A.E. U.A.E. Saudi Arabia U.A.E.
Ownership interest 40.0 % 40.0 % 34.4 % 41.5 % 51.6 % 46.6 % 47.0 %
Carrying amount 1 January 40 376 338 749 –522 295 952 120 444 92 546 70 981 958 525
Net profit / loss (–) during the year –103 141 066 – 180 517 47 640 11 778 24 057 404 954
Exchange differences – 28 487 –31 28 883 10 284 6 028 5 874 79 525
Dividend – –162 100 – –171 765 –73 223 –16 187 –23 806 –447 081
Capital increase –8 556 8 556 – – – – – –
Other equity changes –31 717 31 717 – – – – – –
Carrying amount 31 December – 386 475 –553 333 586 105 144 94 165 77 106 995 924