JOTUN GROUP
34
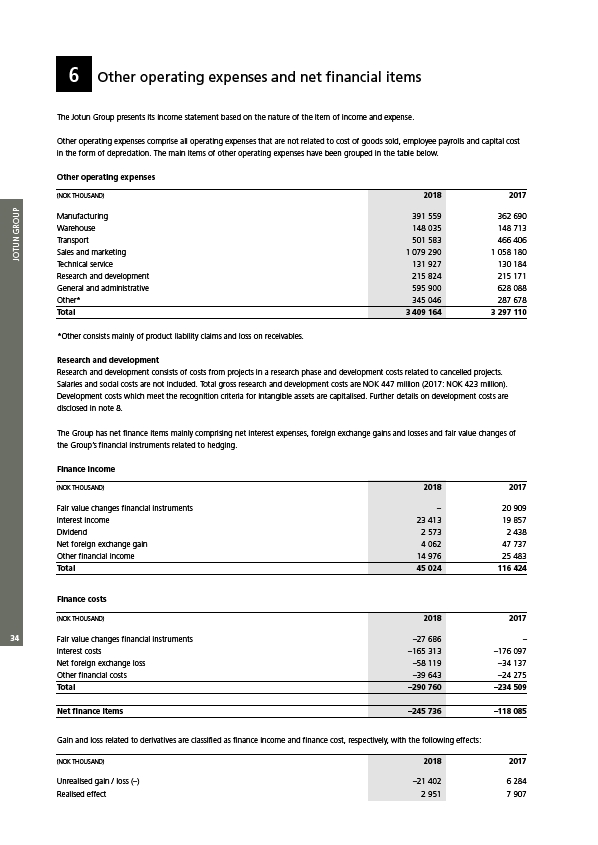
6 Other operating expenses and net financial items
The Jotun Group presents its income statement based on the nature of the item of income and expense.
Other operating expenses comprise all operating expenses that are not related to cost of goods sold, employee payrolls and capital cost
in the form of depreciation. The main items of other operating expenses have been grouped in the table below.
Other operating expenses
(NOK THOUSAND) 2018 2017
Manufacturing 391 559 362 690
Warehouse 148 035 148 713
Transport 501 583 466 406
Sales and marketing 1 079 290 1 058 180
Technical service 131 927 130 184
Research and development 215 824 215 171
General and administrative 595 900 628 088
Other* 345 046 287 678
Total 3 409 164 3 297 110
*Other consists mainly of product liability claims and loss on receivables.
Research and development
Research and development consists of costs from projects in a research phase and development costs related to cancelled projects.
Salaries and social costs are not included. Total gross research and development costs are NOK 447 million (2017: NOK 423 million).
Development costs which meet the recognition criteria for intangible assets are capitalised. Further details on development costs are
disclosed in note 8.
The Group has net finance items mainly comprising net interest expenses, foreign exchange gains and losses and fair value changes of
the Group’s financial instruments related to hedging.
Finance income
(NOK THOUSAND) 2018 2017
Fair value changes financial instruments – 20 909
Interest income 23 413 19 857
Dividend 2 573 2 438
Net foreign exchange gain 4 062 47 737
Other financial income 14 976 25 483
Total 45 024 116 424
Finance costs
(NOK THOUSAND) 2018 2017
Fair value changes financial instruments –27 686 –
Interest costs –165 313 –176 097
Net foreign exchange loss –58 119 –34 137
Other financial costs –39 643 –24 275
Total –290 760 –234 509
Net finance items –245 736 –118 085
Gain and loss related to derivatives are classified as finance income and finance cost, respectively, with the following effects:
(NOK THOUSAND) 2018 2017
Unrealised gain / loss (–) –21 402 6 284
Realised effect 2 951 7 907