JOTUN A/S
67
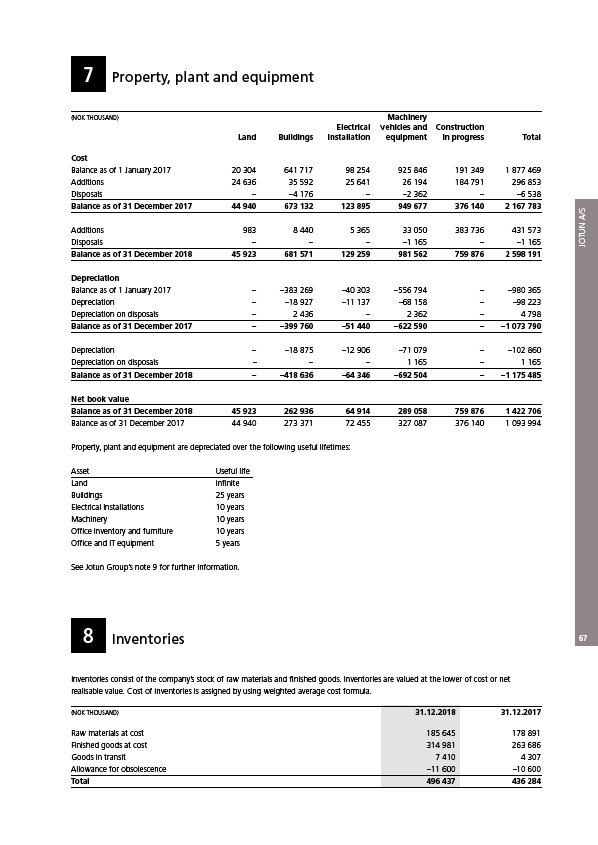
7 Property, plant and equipment
(NOK THOUSAND) Machinery
Electrical vehicles and Construction
Land Buildings Installation equipment in progress Total
Cost
Balance as of 1 January 2017 20 304 641 717 98 254 925 846 191 349 1 877 469
Additions 24 636 35 592 25 641 26 194 184 791 296 853
Disposals – –4 176 – –2 362 – –6 538
Balance as of 31 December 2017 44 940 673 132 123 895 949 677 376 140 2 167 783
Additions 983 8 440 5 365 33 050 383 736 431 573
Disposals – – – –1 165 – –1 165
Balance as of 31 December 2018 45 923 681 571 129 259 981 562 759 876 2 598 191
Depreciation
Balance as of 1 January 2017 – –383 269 –40 303 –556 794 – –980 365
Depreciation – –18 927 –11 137 –68 158 – –98 223
Depreciation on disposals – 2 436 – 2 362 – 4 798
Balance as of 31 December 2017 – –399 760 –51 440 –622 590 – –1 073 790
Depreciation – –18 875 –12 906 –71 079 – –102 860
Depreciation on disposals – – – 1 165 – 1 165
Balance as of 31 December 2018 – –418 636 –64 346 –692 504 – –1 175 485
Net book value
Balance as of 31 December 2018 45 923 262 936 64 914 289 058 759 876 1 422 706
Balance as of 31 December 2017 44 940 273 371 72 455 327 087 376 140 1 093 994
Property, plant and equipment are depreciated over the following useful lifetimes:
Asset Useful life
Land infinite
Buildings 25 years
Electrical Installations 10 years
Machinery 10 years
Office inventory and furniture 10 years
Office and IT equipment 5 years
See Jotun Group’s note 9 for further information.
8 Inventories
Inventories consist of the company’s stock of raw materials and finished goods. Inventories are valued at the lower of cost or net
realisable value. Cost of inventories is assigned by using weighted average cost formula.
(NOK THOUSAND) 31.12.2018 31.12.2017
Raw materials at cost 185 645 178 891
Finished goods at cost 314 981 263 686
Goods in transit 7 410 4 307
Allowance for obsolescence –11 600 –10 600
Total 496 437 436 284