JOTUN GROUP
45
15 Cash and cash equivalents
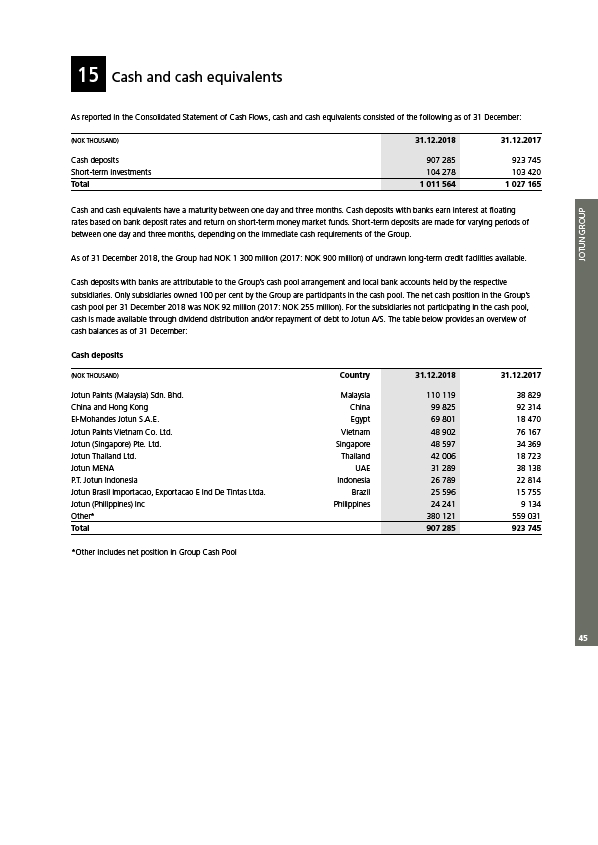
As reported in the Consolidated Statement of Cash Flows, cash and cash equivalents consisted of the following as of 31 December:
(NOK THOUSAND) 31.12.2018 31.12.2017
Cash deposits 907 285 923 745
Short-term investments 104 278 103 420
Total 1 011 564 1 027 165
Cash and cash equivalents have a maturity between one day and three months. Cash deposits with banks earn interest at floating
rates based on bank deposit rates and return on short-term money market funds. Short-term deposits are made for varying periods of
between one day and three months, depending on the immediate cash requirements of the Group.
As of 31 December 2018, the Group had NOK 1 300 million (2017: NOK 900 million) of undrawn long-term credit facilities available.
Cash deposits with banks are attributable to the Group’s cash pool arrangement and local bank accounts held by the respective
subsidiaries. Only subsidiaries owned 100 per cent by the Group are participants in the cash pool. The net cash position in the Group’s
cash pool per 31 December 2018 was NOK 92 million (2017: NOK 255 million). For the subsidiaries not participating in the cash pool,
cash is made available through dividend distribution and/or repayment of debt to Jotun A/S. The table below provides an overview of
cash balances as of 31 December:
Cash deposits
(NOK THOUSAND) Country 31.12.2018 31.12.2017
Jotun Paints (Malaysia) Sdn. Bhd. Malaysia 110 119 38 829
China and Hong Kong China 99 825 92 314
El-Mohandes Jotun S.A.E. Egypt 69 801 18 470
Jotun Paints Vietnam Co. Ltd. Vietnam 48 902 76 167
Jotun (Singapore) Pte. Ltd. Singapore 48 597 34 369
Jotun Thailand Ltd. Thailand 42 006 18 723
Jotun MENA UAE 31 289 38 138
P.T. Jotun Indonesia Indonesia 26 789 22 814
Jotun Brasil Importacao, Exportacao E Ind De Tintas Ltda. Brazil 25 596 15 755
Jotun (Philippines) Inc Philippines 24 241 9 134
Other* 380 121 559 031
Total 907 285 923 745
*Other includes net position in Group Cash Pool