JOTUN A/S
66
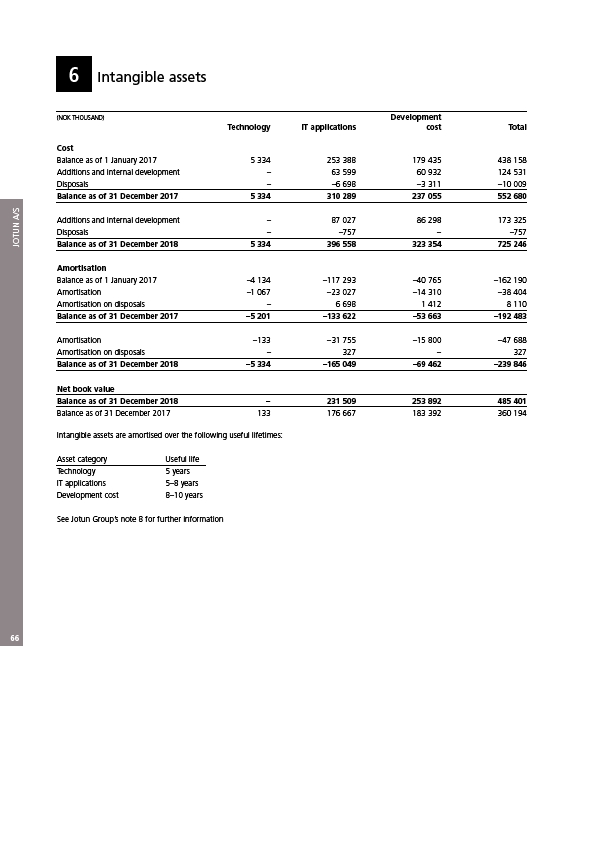
6 Intangible assets
(NOK THOUSAND) Development
Technology IT applications cost Total
Cost
Balance as of 1 January 2017 5 334 253 388 179 435 438 158
Additions and internal development – 63 599 60 932 124 531
Disposals – –6 698 –3 311 –10 009
Balance as of 31 December 2017 5 334 310 289 237 055 552 680
Additions and internal development – 87 027 86 298 173 325
Disposals – –757 – –757
Balance as of 31 December 2018 5 334 396 558 323 354 725 246
Amortisation
Balance as of 1 January 2017 –4 134 –117 293 –40 765 –162 190
Amortisation –1 067 –23 027 –14 310 –38 404
Amortisation on disposals – 6 698 1 412 8 110
Balance as of 31 December 2017 –5 201 –133 622 –53 663 –192 483
Amortisation –133 –31 755 –15 800 –47 688
Amortisation on disposals – 327 – 327
Balance as of 31 December 2018 –5 334 –165 049 –69 462 –239 846
Net book value
Balance as of 31 December 2018 – 231 509 253 892 485 401
Balance as of 31 December 2017 133 176 667 183 392 360 194
Intangible assets are amortised over the following useful lifetimes:
Asset category Useful life
Technology 5 years
IT applications 5–8 years
Development cost 8–10 years
See Jotun Group’s note 8 for further information