7
INTRODUCTION
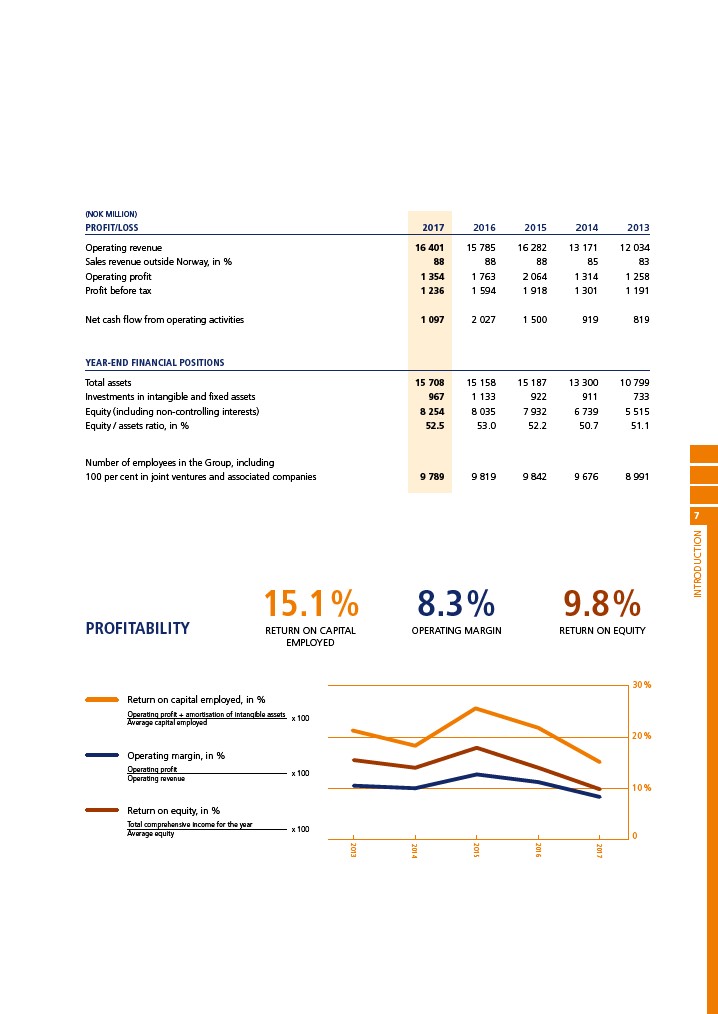
(NOK MILLION)
PROFIT/LOSS 2017 2016 2015 2014 2013
Operating revenue 16 401 15 785 16 282 13 171 12 034
Sales revenue outside Norway, in % 88 88 88 85 83
Operating profit 1 354 1 763 2 064 1 314 1 258
Profit before tax 1 236 1 594 1 918 1 301 1 191
Net cash flow from operating activities 1 097 2 027 1 500 919 819
YEAR-END FINANCIAL POSITIONS
Total assets 15 708 15 158 15 187 13 300 10 799
Investments in intangible and fixed assets 967 1 133 922 911 733
Equity (including non-controlling interests) 8 254 8 035 7 932 6 739 5 515
Equity / assets ratio, in % 52.5 53.0 52.2 50.7 51.1
Number of employees in the Group, including
100 per cent in joint ventures and associated companies 9 789 9 819 9 842 9 676 8 991
PROFITABILITY
2016
2017
2015
15.1 %
RETURN ON CAPITAL
2013
2014
30 %
20 %
10 %
0
Return on capital employed, in %
Operating profit + amortisation of intangible assets
Average capital employed
EMPLOYED
x 100
Operating margin, in %
Operating profit
Operating revenue
x 100
Return on equity, in %
Total comprehensive income for the year
Average equity
x 100
8.3 %
OPERATING MARGIN
9.8 %
RETURN ON EQUITY