28
JOTUN GROUP
INVESTMENTS IN ASSOCIATED COMPANIES AND
2 JOINT VENTURES
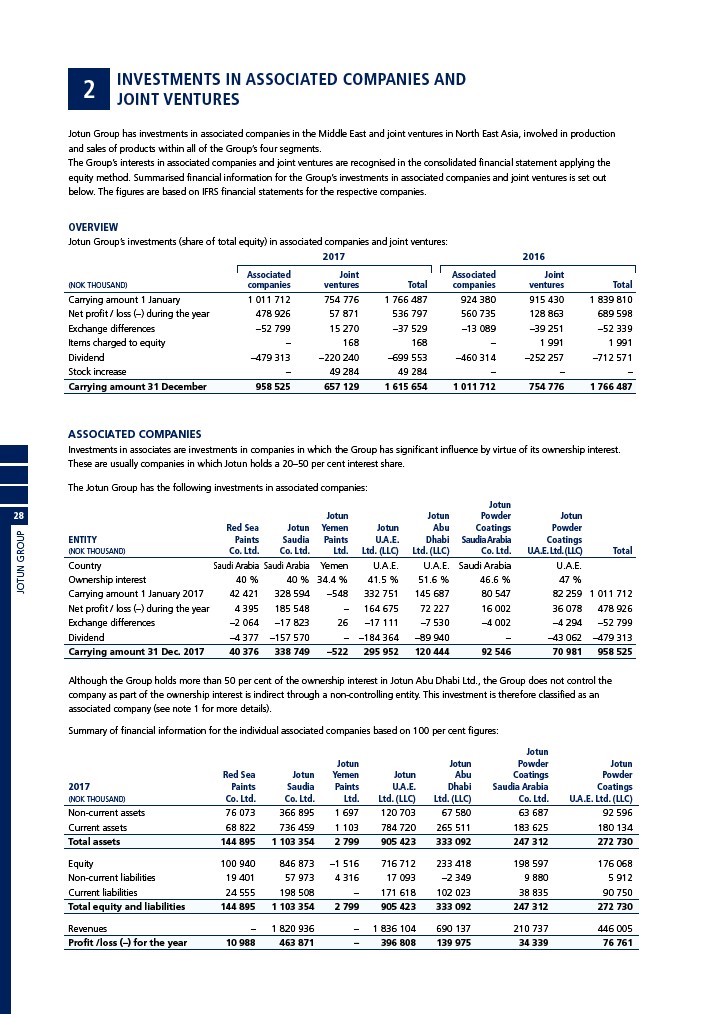
Jotun Group has investments in associated companies in the Middle East and joint ventures in North East Asia, involved in production
and sales of products within all of the Group’s four segments.
The Group’s interests in associated companies and joint ventures are recognised in the consolidated financial statement applying the
equity method. Summarised financial information for the Group’s investments in associated companies and joint ventures is set out
below. The figures are based on IFRS financial statements for the respective companies.
OVERVIEW
Jotun Group’s investments (share of total equity) in associated companies and joint ventures:
2017 2016
Associated Joint Associated Joint
(NOK THOUSAND) companies ventures Total companies ventures Total
Carrying amount 1 January 1 011 712 754 776 1 766 487 924 380 915 430 1 839 810
Net profit / loss (–) during the year 478 926 57 871 536 797 560 735 128 863 689 598
Exchange differences –52 799 15 270 –37 529 –13 089 –39 251 –52 339
Items charged to equity – 168 168 – 1 991 1 991
Dividend –479 313 –220 240 –699 553 –460 314 –252 257 –712 571
Stock increase – 49 284 49 284 – – –
Carrying amount 31 December 958 525 657 129 1 615 654 1 011 712 754 776 1 766 487
ASSOCIATED COMPANIES
Investments in associates are investments in companies in which the Group has significant influence by virtue of its ownership interest.
These are usually companies in which Jotun holds a 20–50 per cent interest share.
The Jotun Group has the following investments in associated companies:
Jotun
Jotun Jotun Powder Jotun
Red Sea Jotun Yemen Jotun Abu Coatings Powder
ENTITY Paints Saudia Paints U.A.E. Dhabi Saudia Arabia Coatings
(NOK THOUSAND) Co. Ltd. Co. Ltd. Ltd. Ltd. (LLC) Ltd. (LLC) Co. Ltd. U.A.E. Ltd. (LLC) Total
Country Saudi Arabia Saudi Arabia Yemen U.A.E. U.A.E. Saudi Arabia U.A.E.
Ownership interest 40 % 40 % 34.4 % 41.5 % 51.6 % 46.6 % 47 %
Carrying amount 1 January 2017 42 421 328 594 –548 332 751 145 687 80 547 82 259 1 011 712
Net profit / loss (–) during the year 4 395 185 548 – 164 675 72 227 16 002 36 078 478 926
Exchange differences –2 064 –17 823 26 –17 111 –7 530 –4 002 –4 294 –52 799
Dividend –4 377 –157 570 – –184 364 –89 940 – –43 062 –479 313
Carrying amount 31 Dec. 2017 40 376 338 749 –522 295 952 120 444 92 546 70 981 958 525
Although the Group holds more than 50 per cent of the ownership interest in Jotun Abu Dhabi Ltd., the Group does not control the
company as part of the ownership interest is indirect through a non-controlling entity. This investment is therefore classified as an
associated company (see note 1 for more details).
Summary of financial information for the individual associated companies based on 100 per cent figures:
Jotun
Jotun Jotun Powder Jotun
Red Sea Jotun Yemen Jotun Abu Coatings Powder
2017 Paints Saudia Paints U.A.E. Dhabi Saudia Arabia Coatings
(NOK THOUSAND) Co. Ltd. Co. Ltd. Ltd. Ltd. (LLC) Ltd. (LLC) Co. Ltd. U.A.E. Ltd. (LLC)
Non-current assets 76 073 366 895 1 697 120 703 67 580 63 687 92 596
Current assets 68 822 736 459 1 103 784 720 265 511 183 625 180 134
Total assets 144 895 1 103 354 2 799 905 423 333 092 247 312 272 730
Equity 100 940 846 873 –1 516 716 712 233 418 198 597 176 068
Non-current liabilities 19 401 57 973 4 316 17 093 –2 349 9 880 5 912
Current liabilities 24 555 198 508 – 171 618 102 023 38 835 90 750
Total equity and liabilities 144 895 1 103 354 2 799 905 423 333 092 247 312 272 730
Revenues – 1 820 936 – 1 836 104 690 137 210 737 446 005
Profit /loss (–) for the year 10 988 463 871 – 396 808 139 975 34 339 76 761