68
JOTUN A/S
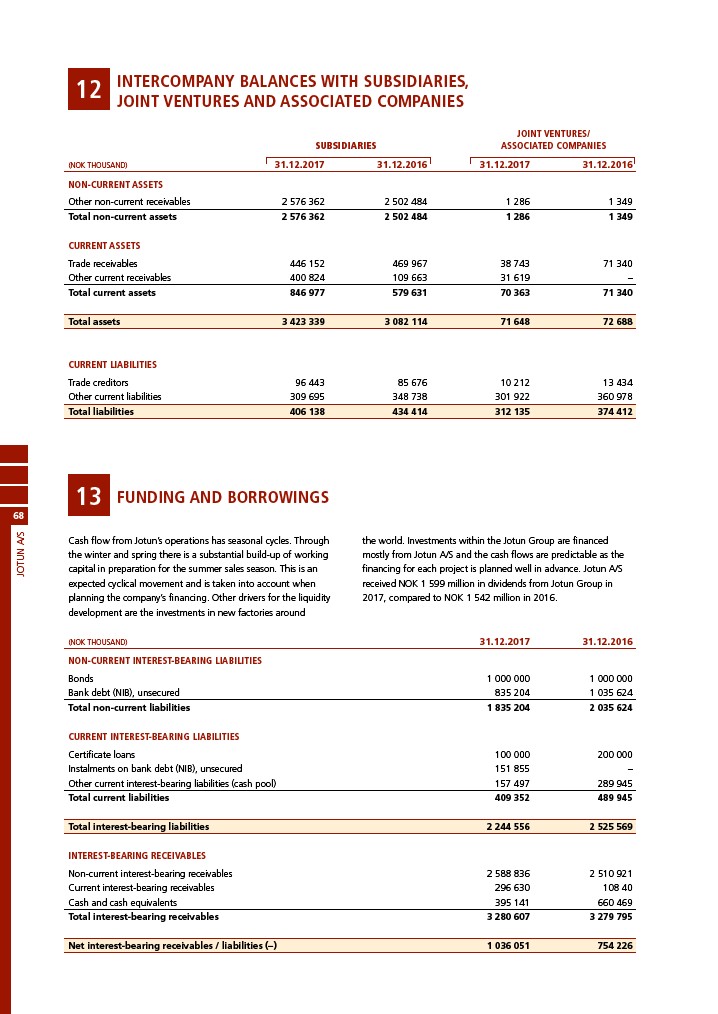
INTERCOMPANY BALANCES WITH SUBSIDIARIES,
JOINT VENTURES AND ASSOCIATED COMPANIES 12
SUBSIDIARIES
JOINT VENTURES/
ASSOCIATED COMPANIES
(NOK THOUSAND) 31.12.2017 31.12.2016 31.12.2017 31.12.2016
NON-CURRENT ASSETS
Other non-current receivables 2 576 362 2 502 484 1 286 1 349
Total non-current assets 2 576 362 2 502 484 1 286 1 349
CURRENT ASSETS
Trade receivables 446 152 469 967 38 743 71 340
Other current receivables 400 824 109 663 31 619 –
Total current assets 846 977 579 631 70 363 71 340
Total assets 3 423 339 3 082 114 71 648 72 688
CURRENT LIABILITIES
Trade creditors 96 443 85 676 10 212 13 434
Other current liabilities 309 695 348 738 301 922 360 978
Total liabilities 406 138 434 414 312 135 374 412
13 FUNDING AND BORROWINGS
Cash flow from Jotun’s operations has seasonal cycles. Through
the winter and spring there is a substantial build-up of working
capital in preparation for the summer sales season. This is an
expected cyclical movement and is taken into account when
planning the company’s financing. Other drivers for the liquidity
development are the investments in new factories around
the world. Investments within the Jotun Group are financed
mostly from Jotun A/S and the cash flows are predictable as the
financing for each project is planned well in advance. Jotun A/S
received NOK 1 599 million in dividends from Jotun Group in
2017, compared to NOK 1 542 million in 2016.
(NOK THOUSAND) 31.12.2017 31.12.2016
NON-CURRENT INTEREST-BEARING LIABILITIES
Bonds 1 000 000 1 000 000
Bank debt (NIB), unsecured 835 204 1 035 624
Total non-current liabilities 1 835 204 2 035 624
CURRENT INTEREST-BEARING LIABILITIES
Certificate loans 100 000 200 000
Instalments on bank debt (NIB), unsecured 151 855 –
Other current interest-bearing liabilities (cash pool) 157 497 289 945
Total current liabilities 409 352 489 945
Total interest-bearing liabilities 2 244 556 2 525 569
INTEREST-BEARING RECEIVABLES
Non-current interest-bearing receivables 2 588 836 2 510 921
Current interest-bearing receivables 296 630 108 40
Cash and cash equivalents 395 141 660 469
Total interest-bearing receivables 3 280 607 3 279 795
Net interest-bearing receivables / liabilities (–) 1 036 051 754 226