63
JOTUN A/S
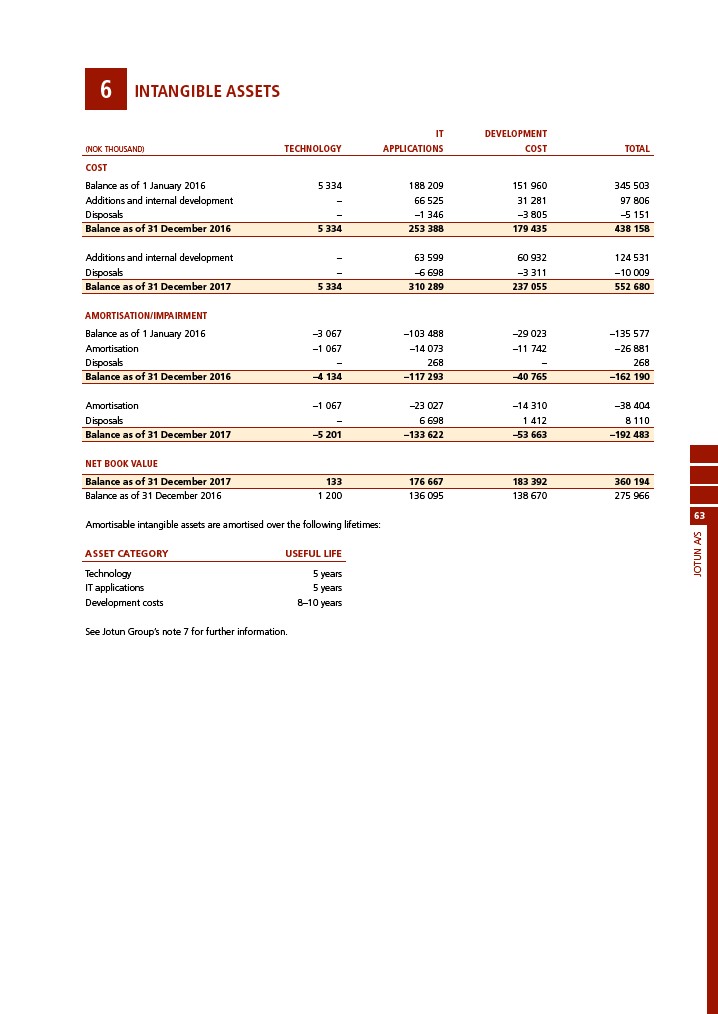
6 INTANGIBLE ASSETS
IT DEVELOPMENT
(NOK THOUSAND) TECHNOLOGY APPLICATIONS COST TOTAL
COST
Balance as of 1 January 2016 5 334 188 209 151 960 345 503
Additions and internal development – 66 525 31 281 97 806
Disposals – –1 346 –3 805 –5 151
Balance as of 31 December 2016 5 334 253 388 179 435 438 158
Additions and internal development – 63 599 60 932 124 531
Disposals – –6 698 –3 311 –10 009
Balance as of 31 December 2017 5 334 310 289 237 055 552 680
AMORTISATION/IMPAIRMENT
Balance as of 1 January 2016 –3 067 –103 488 –29 023 –135 577
Amortisation –1 067 –14 073 –11 742 –26 881
Disposals – 268 – 268
Balance as of 31 December 2016 –4 134 –117 293 –40 765 –162 190
Amortisation –1 067 –23 027 –14 310 –38 404
Disposals – 6 698 1 412 8 110
Balance as of 31 December 2017 –5 201 –133 622 –53 663 –192 483
NET BOOK VALUE
Balance as of 31 December 2017 133 176 667 183 392 360 194
Balance as of 31 December 2016 1 200 136 095 138 670 275 966
Amortisable intangible assets are amortised over the following lifetimes:
ASSET CATEGORY USEFUL LIFE
Technology 5 years
IT applications 5 years
Development costs 8–10 years
See Jotun Group’s note 7 for further information.