43
JOTUN GROUP
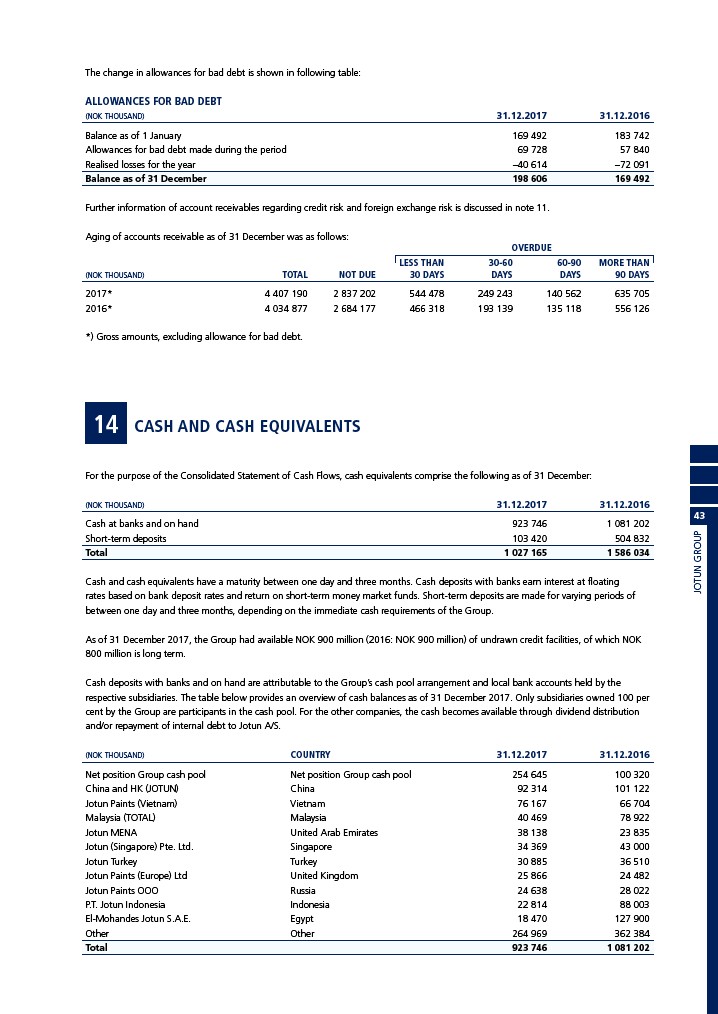
The change in allowances for bad debt is shown in following table:
ALLOWANCES FOR BAD DEBT
(NOK THOUSAND) 31.12.2017 31.12.2016
Balance as of 1 January 169 492 183 742
Allowances for bad debt made during the period 69 728 57 840
Realised losses for the year –40 614 –72 091
Balance as of 31 December 198 606 169 492
Further information of account receivables regarding credit risk and foreign exchange risk is discussed in note 11.
Aging of accounts receivable as of 31 December was as follows:
OVERDUE
LESS THAN 30-60 60-90 MORE THAN
(NOK THOUSAND) TOTAL NOT DUE 30 DAYS DAYS DAYS 90 DAYS
2017* 4 407 190 2 837 202 544 478 249 243 140 562 635 705
2016* 4 034 877 2 684 177 466 318 193 139 135 118 556 126
*) Gross amounts, excluding allowance for bad debt.
14 CASH AND CASH EQUIVALENTS
For the purpose of the Consolidated Statement of Cash Flows, cash equivalents comprise the following as of 31 December:
(NOK THOUSAND) 31.12.2017 31.12.2016
Cash at banks and on hand 923 746 1 081 202
Short-term deposits 103 420 504 832
Total 1 027 165 1 586 034
Cash and cash equivalents have a maturity between one day and three months. Cash deposits with banks earn interest at floating
rates based on bank deposit rates and return on short-term money market funds. Short-term deposits are made for varying periods of
between one day and three months, depending on the immediate cash requirements of the Group.
As of 31 December 2017, the Group had available NOK 900 million (2016: NOK 900 million) of undrawn credit facilities, of which NOK
800 million is long term.
Cash deposits with banks and on hand are attributable to the Group’s cash pool arrangement and local bank accounts held by the
respective subsidiaries. The table below provides an overview of cash balances as of 31 December 2017. Only subsidiaries owned 100 per
cent by the Group are participants in the cash pool. For the other companies, the cash becomes available through dividend distribution
and/or repayment of internal debt to Jotun A/S.
(NOK THOUSAND) COUNTRY 31.12.2017 31.12.2016
Net position Group cash pool Net position Group cash pool 254 645 100 320
China and HK (JOTUN) China 92 314 101 122
Jotun Paints (Vietnam) Vietnam 76 167 66 704
Malaysia (TOTAL) Malaysia 40 469 78 922
Jotun MENA United Arab Emirates 38 138 23 835
Jotun (Singapore) Pte. Ltd. Singapore 34 369 43 000
Jotun Turkey Turkey 30 885 36 510
Jotun Paints (Europe) Ltd United Kingdom 25 866 24 482
Jotun Paints OOO Russia 24 638 28 022
P.T. Jotun Indonesia Indonesia 22 814 88 003
El-Mohandes Jotun S.A.E. Egypt 18 470 127 900
Other Other 264 969 362 384
Total 923 746 1 081 202