41
JOTUN GROUP
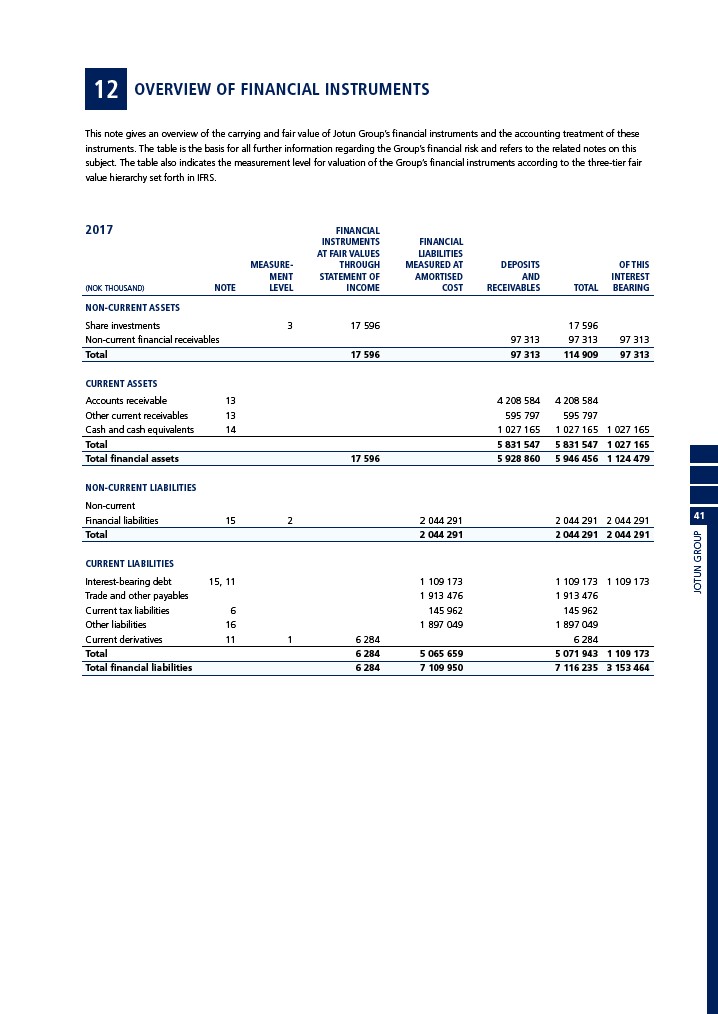
12 OVERVIEW OF FINANCIAL INSTRUMENTS
This note gives an overview of the carrying and fair value of Jotun Group’s financial instruments and the accounting treatment of these
instruments. The table is the basis for all further information regarding the Group’s financial risk and refers to the related notes on this
subject. The table also indicates the measurement level for valuation of the Group’s financial instruments according to the three-tier fair
value hierarchy set forth in IFRS.
2017 FINANCIAL
INSTRUMENTS FINANCIAL
AT FAIR VALUES LIABILITIES
MEASURE- THROUGH MEASURED AT DEPOSITS OF THIS
MENT STATEMENT OF AMORTISED AND INTEREST
(NOK THOUSAND) NOTE LEVEL INCOME COST RECEIVABLES TOTAL BEARING
NON-CURRENT ASSETS
Share investments 3 17 596 17 596
Non-current financial receivables 97 313 97 313 97 313
Total 17 596 97 313 114 909 97 313
CURRENT ASSETS
Accounts receivable 13 4 208 584 4 208 584
Other current receivables 13 595 797 595 797
Cash and cash equivalents 14 1 027 165 1 027 165 1 027 165
Total 5 831 547 5 831 547 1 027 165
Total financial assets 17 596 5 928 860 5 946 456 1 124 479
NON-CURRENT LIABILITIES
Non-current
Financial liabilities 15 2 2 044 291 2 044 291 2 044 291
Total 2 044 291 2 044 291 2 044 291
CURRENT LIABILITIES
Interest-bearing debt 15, 11 1 109 173 1 109 173 1 109 173
Trade and other payables 1 913 476 1 913 476
Current tax liabilities 6 145 962 145 962
Other liabilities 16 1 897 049 1 897 049
Current derivatives 11 1 6 284 6 284
Total 6 284 5 065 659 5 071 943 1 109 173
Total financial liabilities 6 284 7 109 950 7 116 235 3 153 464