FINANCIAL PERFORMANCE
74
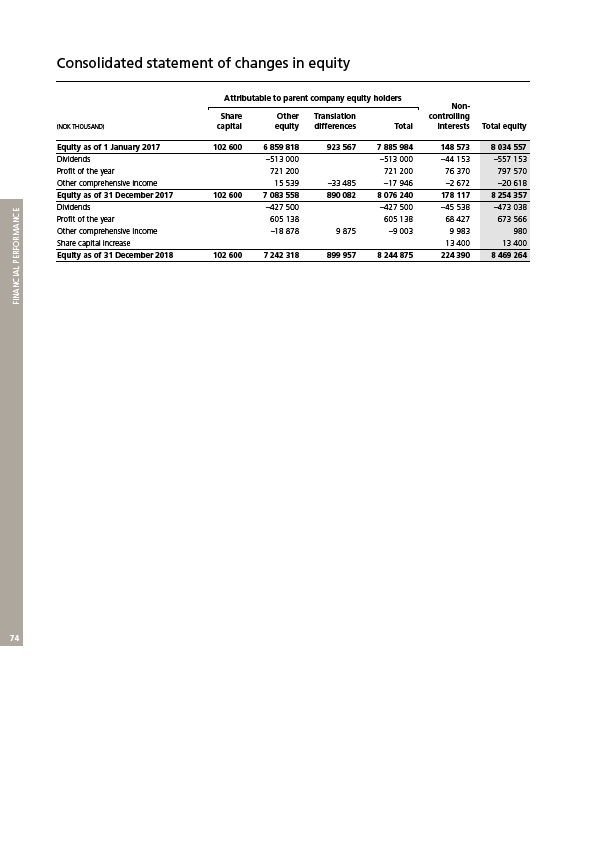
Consolidated statement of changes in equity
Attributable to parent company equity holders
Non-
Share Other Translation controlling
(NOK THOUSAND) capital equity differences Total interests Total equity
Equity as of 1 January 2017 102 600 6 859 818 923 567 7 885 984 148 573 8 034 557
Dividends –513 000 –513 000 –44 153 –557 153
Profit of the year 721 200 721 200 76 370 797 570
Other comprehensive income 15 539 –33 485 –17 946 –2 672 –20 618
Equity as of 31 December 2017 102 600 7 083 558 890 082 8 076 240 178 117 8 254 357
Dividends –427 500 –427 500 –45 538 –473 038
Profit of the year 605 138 605 138 68 427 673 566
Other comprehensive income –18 878 9 875 –9 003 9 983 980
Share capital increase 13 400 13 400
Equity as of 31 December 2018 102 600 7 242 318 899 957 8 244 875 224 390 8 469 264