INTRODUCTION
2
Jotun Group
In response to consumer and industrial demand, Jotun is migrating from a products-based offering to a
solutions-based offering.
For more than 90 years, Jotun has developed paints and
coatings to protect and beautify assets. However, as more
consumers and businesses are turning to paints and coatings to
help solve different challenges, Jotun has expanded its service
offering in every segment to meet specific end user needs.
Performance coatings solutions
For example, shipowners seeking to reduce fuel costs and
lower corresponding carbon emissions can utilise Jotun’s Hull
Performance Solutions, which combines premium marine
antifoulings, priority technical service and tools to measure hull
performance. For stakeholders seeking to reduce application
and maintenance costs in the hydrocarbon processing industry,
Jotun offers Thermosafe. This collection of five coatings
solutions provides protection against a range of risks and issues,
from fire to cryogenic spills, thermal exposure to corrosion
under insulation.
In the Powder Coatings segment, Jotun develops solutions
not only for end users but also for applicators. To serve this
important customer group, Jotun has created client teams
that include sales, technical sales support and R&D personnel
to work closely with applicators to help them achieve optimal
results. In the Decorative Paints segment, Jotun offers Global
Colour Trends, an annual collection of trendy, inspiring colour
schemes, linked by a common theme, that makes it easier for
consumers and designers to select and match complementary
colours. For project owners seeking to simplify supplier
relationships, Jotun works across the Decorative Paints, and
Protective and Powder Coatings segments to offer the Single
Source Solution.
Customer loyalty
By developing products and services to meet specific needs,
Jotun helps customers manage challenges. This approach
encourages long-term partnerships, builds customer loyalty and
allows Jotun to compete for more profitable contracts.
Selling solutions
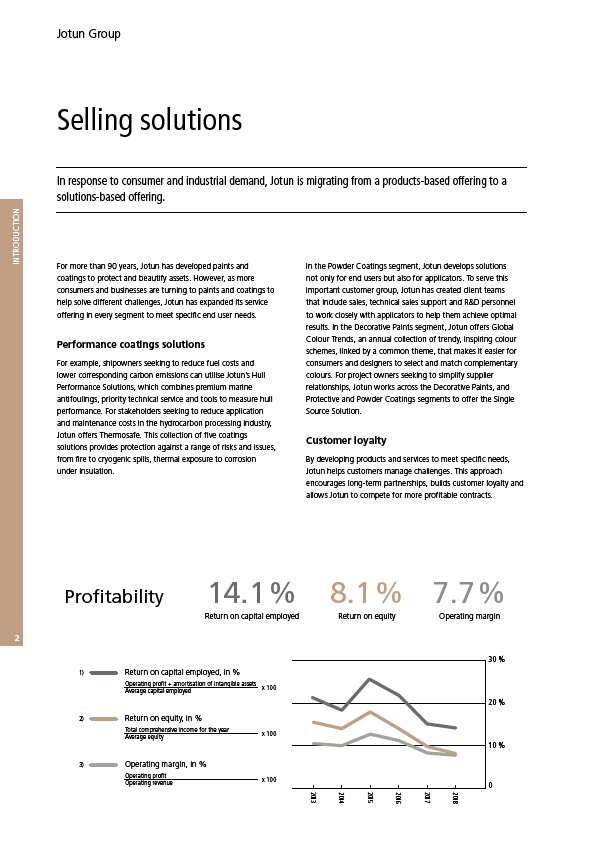
Profitability
2016
2017
2015
2013
2014
30 %
20 %
10 %
0
1) Return on capital employed, in %
2)
3)
Operating profit + amortisation of intangible assets
Average capital employed
x 100
Return on equity, in %
Total comprehensive income for the year
Average equity
x 100
Operating margin, in %
Operating profit
Operating revenue
x 100
2018
14.1 %
Return on capital employed
7.7 %
Operating margin
8.1 %
Return on equity