FINANCIAL PERFORMANCE
73
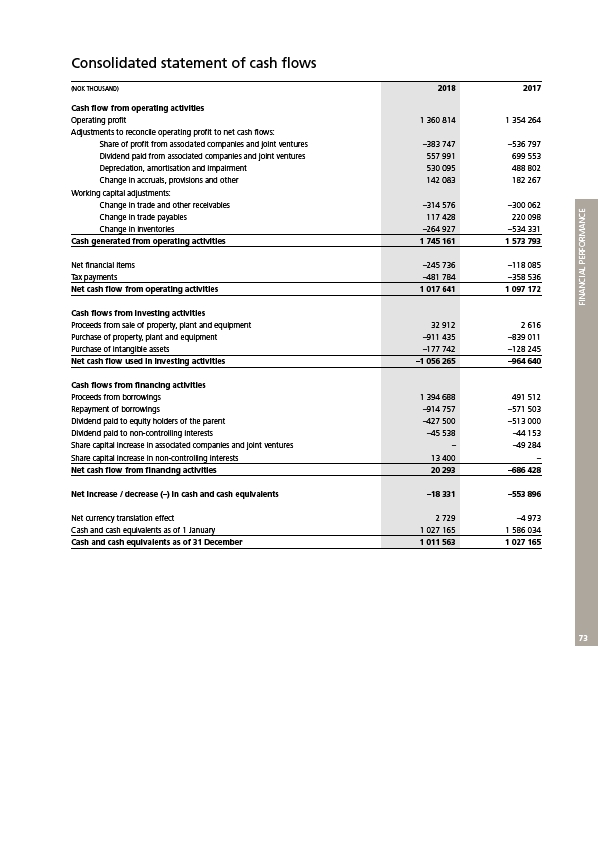
Consolidated statement of cash flows
(NOK THOUSAND) 2018 2017
Cash flow from operating activities
Operating profit 1 360 814 1 354 264
Adjustments to reconcile operating profit to net cash flows:
Share of profit from associated companies and joint ventures –383 747 –536 797
Dividend paid from associated companies and joint ventures 557 991 699 553
Depreciation, amortisation and impairment 530 095 488 802
Change in accruals, provisions and other 142 083 182 267
Working capital adjustments:
Change in trade and other receivables –314 576 –300 062
Change in trade payables 117 428 220 098
Change in inventories –264 927 –534 331
Cash generated from operating activities 1 745 161 1 573 793
Net financial items –245 736 –118 085
Tax payments –481 784 –358 536
Net cash flow from operating activities 1 017 641 1 097 172
Cash flows from investing activities
Proceeds from sale of property, plant and equipment 32 912 2 616
Purchase of property, plant and equipment –911 435 –839 011
Purchase of intangible assets –177 742 –128 245
Net cash flow used in investing activities –1 056 265 –964 640
Cash flows from financing activities
Proceeds from borrowings 1 394 688 491 512
Repayment of borrowings –914 757 –571 503
Dividend paid to equity holders of the parent –427 500 –513 000
Dividend paid to non-controlling interests –45 538 –44 153
Share capital increase in associated companies and joint ventures – –49 284
Share capital increase in non-controlling interests 13 400 –
Net cash flow from financing activities 20 293 –686 428
Net increase / decrease (–) in cash and cash equivalents –18 331 –553 896
Net currency translation effect 2 729 –4 973
Cash and cash equivalents as of 1 January 1 027 165 1 586 034
Cash and cash equivalents as of 31 December 1 011 563 1 027 165