FINANCIAL PERFORMANCE
71
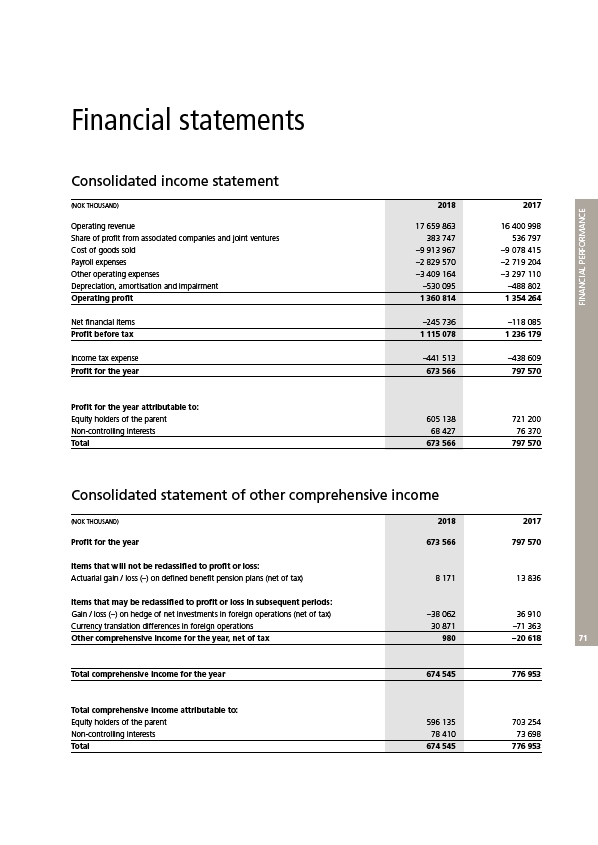
Financial statements
Consolidated income statement
(NOK THOUSAND) 2018 2017
Operating revenue 17 659 863 16 400 998
Share of profit from associated companies and joint ventures 383 747 536 797
Cost of goods sold –9 913 967 –9 078 415
Payroll expenses –2 829 570 –2 719 204
Other operating expenses –3 409 164 –3 297 110
Depreciation, amortisation and impairment –530 095 –488 802
Operating profit 1 360 814 1 354 264
Net financial items –245 736 –118 085
Profit before tax 1 115 078 1 236 179
Income tax expense –441 513 –438 609
Profit for the year 673 566 797 570
Profit for the year attributable to:
Equity holders of the parent 605 138 721 200
Non-controlling interests 68 427 76 370
Total 673 566 797 570
Consolidated statement of other comprehensive income
(NOK THOUSAND) 2018 2017
Profit for the year 673 566 797 570
Items that will not be reclassified to profit or loss:
Actuarial gain / loss (–) on defined benefit pension plans (net of tax) 8 171 13 836
Items that may be reclassified to profit or loss in subsequent periods:
Gain / loss (–) on hedge of net investments in foreign operations (net of tax) –38 062 36 910
Currency translation differences in foreign operations 30 871 –71 363
Other comprehensive income for the year, net of tax 980 –20 618
Total comprehensive income for the year 674 545 776 953
Total comprehensive income attributable to:
Equity holders of the parent 596 135 703 254
Non-controlling interests 78 410 73 698
Total 674 545 776 953