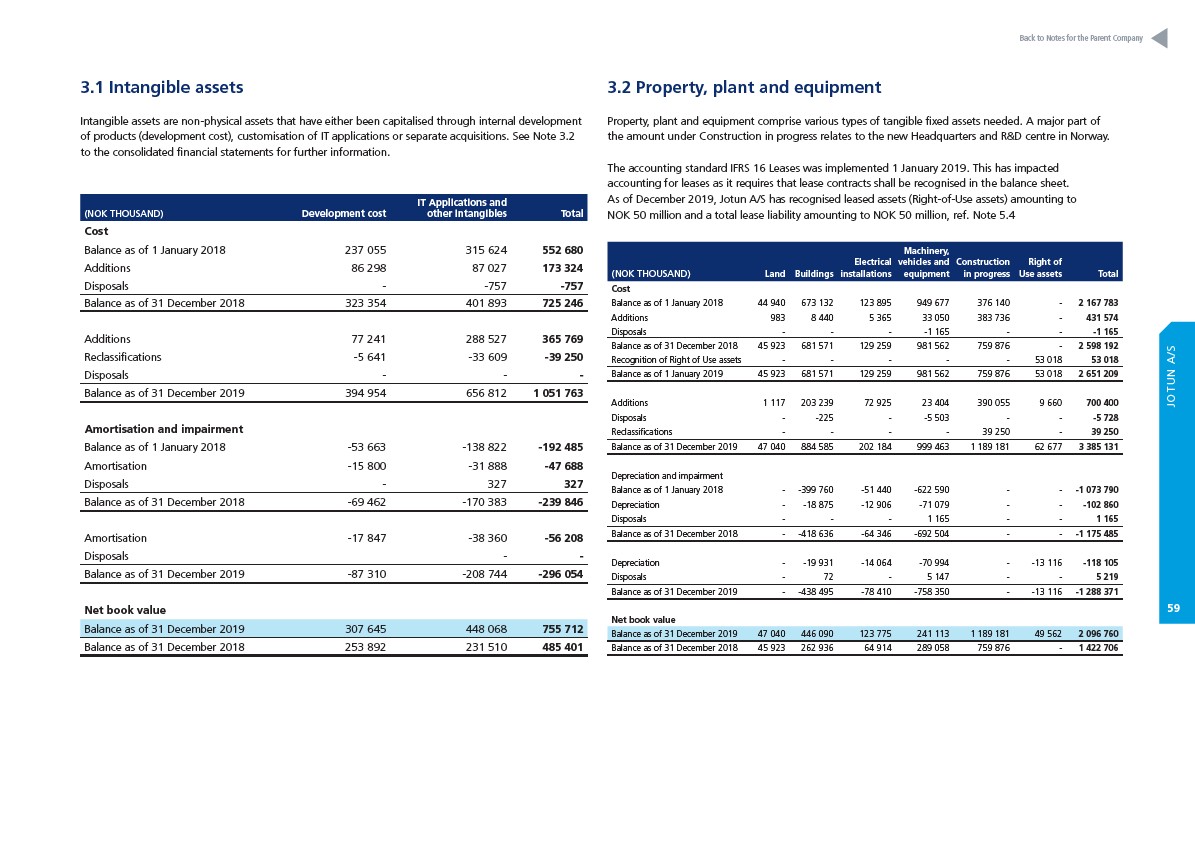
3.1 Intangible assets
Intangible assets are non-physical assets that have either been capitalised through internal development
of products (development cost), customisation of IT applications or separate acquisitions. See Note 3.2
to the consolidated financial statements for further information.
(NOK THOUSAND) Development cost
IT Applications and
other intangibles Total
Cost
Balance as of 1 January 2018 237 055 315 624 552 680
Additions 86 298 87 027 173 324
Disposals - -757 -757
Balance as of 31 December 2018 323 354 401 893 725 246
Additions 77 241 288 527 365 769
Reclassifications -5 641 -33 609 -39 250
Disposals - - -
Balance as of 31 December 2019 394 954 656 812 1 051 763
Amortisation and impairment
Balance as of 1 January 2018 -53 663 -138 822 -192 485
Amortisation -15 800 -31 888 -47 688
Disposals - 327 327
Balance as of 31 December 2018 -69 462 -170 383 -239 846
Amortisation -17 847 -38 360 -56 208
Disposals - -
Balance as of 31 December 2019 -87 310 -208 744 -296 054
Net book value
Balance as of 31 December 2019 307 645 448 068 755 712
Balance as of 31 December 2018 253 892 231 510 485 401
Back to Notes for the Parent Company
3.2 Property, plant and equipment
Property, plant and equipment comprise various types of tangible fixed assets needed. A major part of
the amount under Construction in progress relates to the new Headquarters and R&D centre in Norway.
The accounting standard IFRS 16 Leases was implemented 1 January 2019. This has impacted
accounting for leases as it requires that lease contracts shall be recognised in the balance sheet.
As of December 2019, Jotun A/S has recognised leased assets (Right-of-Use assets) amounting to
NOK 50 million and a total lease liability amounting to NOK 50 million, ref. Note 5.4
(NOK THOUSAND) Land Buildings
Electrical
installations
Machinery,
vehicles and
equipment
Construction
in progress
Right of
Use assets Total
Cost
Balance as of 1 January 2018 44 940 673 132 123 895 949 677 376 140 - 2 167 783
Additions 983 8 440 5 365 33 050 383 736 - 431 574
Disposals - - - -1 165 - - -1 165
Balance as of 31 December 2018 45 923 681 571 129 259 981 562 759 876 - 2 598 192
Recognition of Right of Use assets - - - - - 53 018 53 018
Balance as of 1 January 2019 45 923 681 571 129 259 981 562 759 876 53 018 2 651 209
Additions 1 117 203 239 72 925 23 404 390 055 9 660 700 400
Disposals - -225 - -5 503 - - -5 728
Reclassifications - - - - 39 250 - 39 250
Balance as of 31 December 2019 47 040 884 585 202 184 999 463 1 189 181 62 677 3 385 131
Depreciation and impairment
Balance as of 1 January 2018 - -399 760 -51 440 -622 590 - - -1 073 790
Depreciation - -18 875 -12 906 -71 079 - - -102 860
Disposals - - - 1 165 - - 1 165
Balance as of 31 December 2018 - -418 636 -64 346 -692 504 - - -1 175 485
Depreciation - -19 931 -14 064 -70 994 - -13 116 -118 105
Disposals - 72 - 5 147 - - 5 219
Balance as of 31 December 2019 - -438 495 -78 410 -758 350 - -13 116 -1 288 371
Net book value
Balance as of 31 December 2019 47 040 446 090 123 775 241 113 1 189 181 49 562 2 096 760
Balance as of 31 December 2018 45 923 262 936 64 914 289 058 759 876 - 1 422 706
JOTUN A/S
59