(NOK THOUSAND) Country
Associates
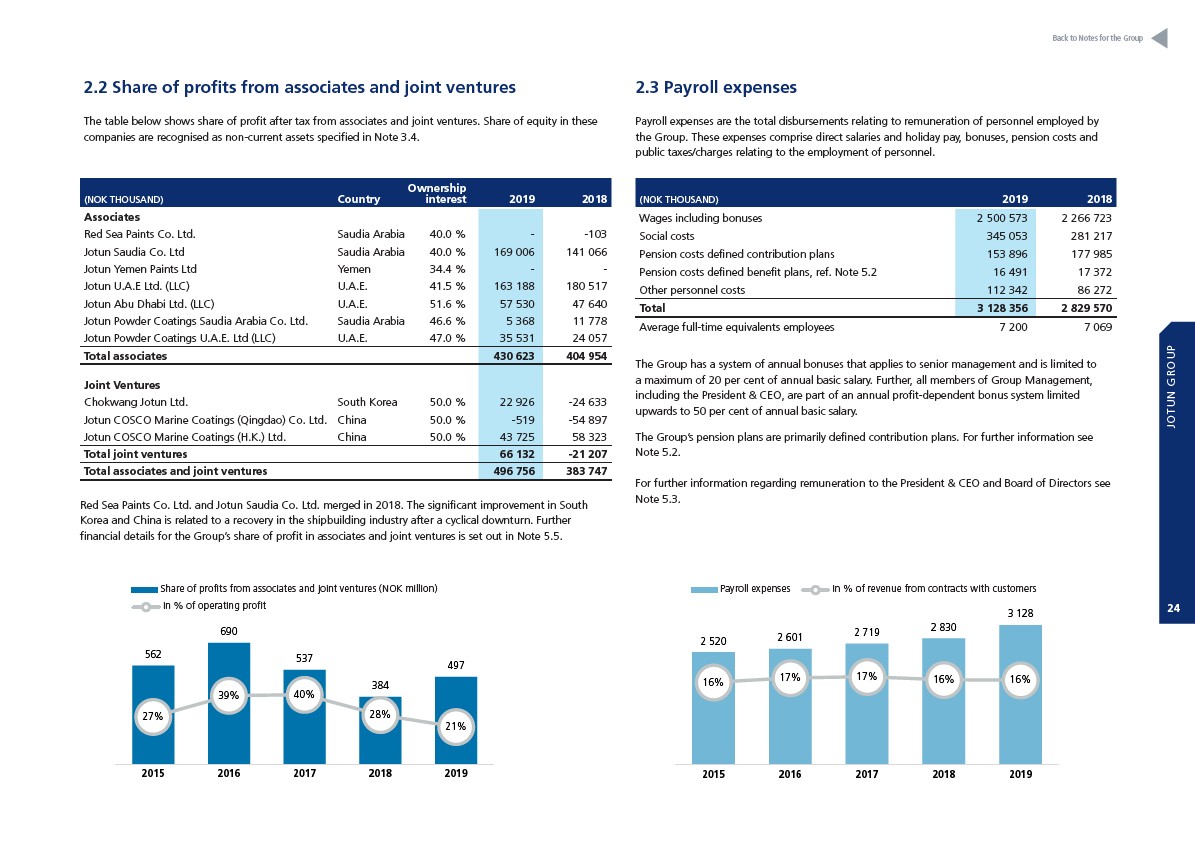
Red Sea Paints Co. Ltd. Saudia Arabia 40.0 % - -103
Jotun Saudia Co. Ltd Saudia Arabia 40.0 % 169 006 141 066
Jotun Yemen Paints Ltd Yemen 34.4 % - -
Jotun U.A.E Ltd. (LLC) U.A.E. 41.5 % 163 188 180 517
Jotun Abu Dhabi Ltd. (LLC) U.A.E. 51.6 % 57 530 47 640
Jotun Powder Coatings Saudia Arabia Co. Ltd. Saudia Arabia 46.6 % 5 368 11 778
Jotun Powder Coatings U.A.E. Ltd (LLC) U.A.E. 47.0 % 35 531 24 057
Total associates 430 623 404 954
Joint Ventures
Chokwang Jotun Ltd. South Korea 50.0 % 22 926 -24 633
Jotun COSCO Marine Coatings (Qingdao) Co. Ltd. China 50.0 % -519 -54 897
Jotun COSCO Marine Coatings (H.K.) Ltd. China 50.0 % 43 725 58 323
Total joint
ventures 66 132 -21 207
Total associates and joint ventures 496 756 383 747
Red Sea Paints Co. Ltd. and Jotun Saudia Co. Ltd. merged in 2018. The significant improvement in South
Korea and China is related to a recovery in the shipbuilding industry after a cyclical downturn. Further
financial details for the Group’s share of profit in associates and joint ventures is set out in Note 5.5.
562
Ownership
interest 2019 2018
Share of profits from associates and joint ventures (NOK mill)
In % of Operating profit
690
537
384
497
27%
39% 40%
28%
21%
80,0%
70,0%
60,0%
50,0%
40,0%
30,0%
20,0%
10,0%
0,0%
800
700
600
500
400
300
200
100
0
2015 2016 2017 2018 2019
2.3 Payroll expenses
Payroll expenses are the total disbursements relating to remuneration of personnel employed by
the Group. These expenses comprise direct salaries and holiday pay, bonuses, pension costs and
public taxes/charges relating to the employment of personnel.
(NOK THOUSAND) 2019 2018
Wages including bonuses Share of profits from associates and joint ventures (NOK 2 500 mill)
573 2 266 723
Social costs 345 053 281 217
In % of Operating profit
Pension costs defined contribution plans 153 896 177 985
Pension costs defined benefit 690
plans, ref. Note 5.2 16 491 17 372
Other personnel costs 112 342 86 272
562
Total 537
3 128 356 2 829 570
Average full-time equivalents employees 7 200 7 069
384
497
27%
39% 40%
28%
21%
80,0%
70,0%
60,0%
50,0%
40,0%
30,0%
20,0%
10,0%
0,0%
800
700
600
500
400
300
200
100
0
2015 2016 2017 2018 2019
Payroll expenses In % of Revenue from contracts with customers
2 520 2 601 2 719 2 830
3 128
16% 17% 17% 16% 16%
30,0%
25,0%
20,0%
15,0%
10,0%
5,0%
0,0%
3 500
3 000
2 500
2 000
1 500
1 000
500
0
2015 2016 2017 2018 2019
2.2 Share of profits from associates and joint ventures
The table below shows share of profit after tax from associates and joint ventures. Share of equity in these
companies are recognised as non-current assets specified in Note 3.4.
The Group has a system of annual bonuses that applies to senior management and is limited to
a maximum of 20 per cent of annual basic salary. Further, all members of Group Management,
including the President & CEO, are part of an annual profit-dependent bonus system limited
upwards to 50 per cent of annual basic salary.
The Group’s pension plans are primarily defined contribution plans. For further information see
Note 5.2.
For further information regarding remuneration to the President & CEO and Board of Directors see
Note 5.3.
Share of profits from associates and joint ventures (NOK million)
In % of operating profit
Payroll expenses In % of revenue from contracts with customers
Back to Notes for the Group
JOTUN GROUP
24