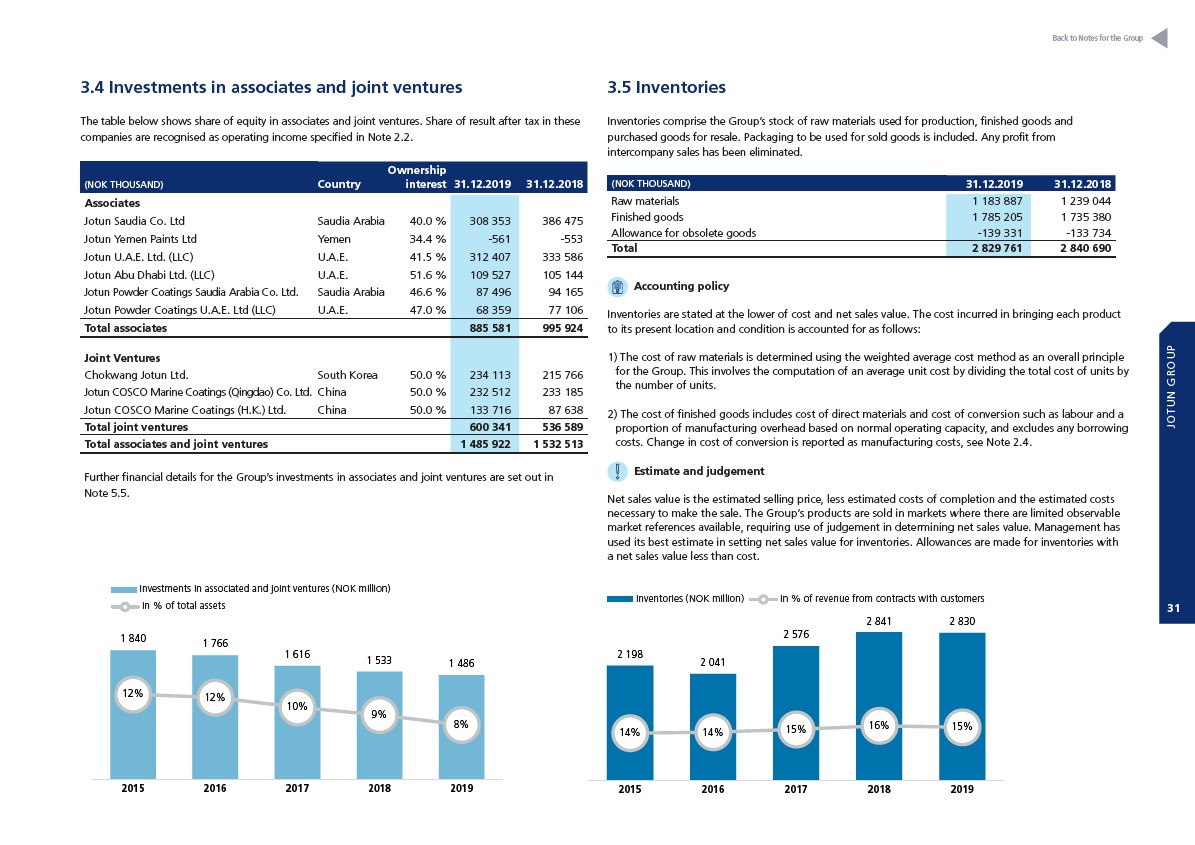
3.4 Investments in associates and joint ventures
The table below shows share of equity in associates and joint ventures. Share of result after tax in these
companies are recognised as operating income specified in Note 2.2.
(NOK THOUSAND) Country
Ownership
2 000
interest 31.12.2019 31.12.2018
Associates
Jotun Saudia Co. Ltd Saudia Arabia 40.0 % 308 353 386 475
Jotun Yemen Paints Ltd Yemen 34.4 % -561 -553
Jotun U.A.E. Ltd. (LLC) U.A.E. 41.5 % 312 407 333 586
Jotun Abu Dhabi Ltd. (LLC) U.A.E. 51.6 % 109 527 105 144
Jotun Powder Coatings Saudia Arabia Co. Ltd. Saudia Arabia 46.6 % 87 496 94 165
Jotun Powder Coatings U.A.E. Ltd (LLC) U.A.E. 47.0 % 68 359 77 106
Total associates 885 581 995 924
1 500
1 000
500
Joint Ventures
Chokwang Jotun Ltd. South Korea 50.0 % 234 113 215 766
Jotun COSCO Marine Coatings (Qingdao) Co. Ltd. China 50.0 % 232 512 233 185
Jotun COSCO Marine Coatings (H.K.) Ltd. China 50.0 % 133 716 87 638
Total joint ventures 600 341 536 589
Total associates and joint ventures 1 485 922 1 532 513
Further financial details for the Group’s investments in associates and joint ventures are set out in
Note 5.5.
Investments in associated companies and joint ventures (NOK million)
In % of Total assets
1 840 1 766
1 616
1 533 1 486
12% 12%
10%
9%
8%
20%
15%
10%
5%
0%
2 000
1 500
1 000
500
0
2015 2016 2017 2018 2019
3.5 Inventories
Inventories comprise the Group’s stock of raw materials used for production, finished goods and
purchased goods for resale. Packaging to be used for sold goods is included. Any profit from
intercompany sales has been eliminated.
Investments in associated companies and joint ventures (NOK million)
In % of Total assets
1 840 1 766
20%
(NOK THOUSAND) 31.12.2019 31.12.2018
Raw materials 1 183 887 1 239 044
Finished goods 1 785 205 1 735 380
Allowance 12% for obsolete goods -139 331 -133 734
12%
Total 2 829 761 2 840 690
Accounting policy
1 616
1 533 1 486
10%
9%
8%
15%
10%
5%
Inventories are stated at the lower of cost and net sales value. The cost incurred in bringing 0%
each product
to its present location and condition is accounted for as follows:
1) The cost of raw materials is determined using the weighted average cost method as an overall principle
for the Group. This involves the computation of an average unit cost by dividing the total cost of units by
the number of units.
2) The cost of finished goods includes cost of direct materials and cost of conversion such as labour and a
proportion of manufacturing overhead based on normal operating capacity, and excludes any borrowing
costs. Change in cost of conversion is reported as manufacturing costs, see Note 2.4.
Estimate and judgement
Net sales value is the estimated selling price, less estimated costs of completion and the estimated costs
necessary to make the sale. The Group’s products are sold in markets where there are limited observable
market references available, requiring use of judgement in determining net sales value. Management has
used its best estimate in setting net sales value for inventories. Allowances are made for inventories with
a net sales value less than cost.
0
2015 2016 2017 2018 2019
Inventories (NOK million) In % of Revenue from contracts with customers*
2 198
2 041
2 576
2 841 2 830
14% 14% 15% 16% 15%
45,0%
40,0%
35,0%
30,0%
25,0%
20,0%
15,0%
10,0%
5,0%
0,0%
3 000
2 500
2 000
1 500
1 000
500
0
2015 2016 2017 2018 2019
Investments in associated and joint ventures (NOK million)
In % of total assets
Inventories (NOK million) In % of revenue from contracts with customers
Back to Notes for the Group
JOTUN GROUP
31