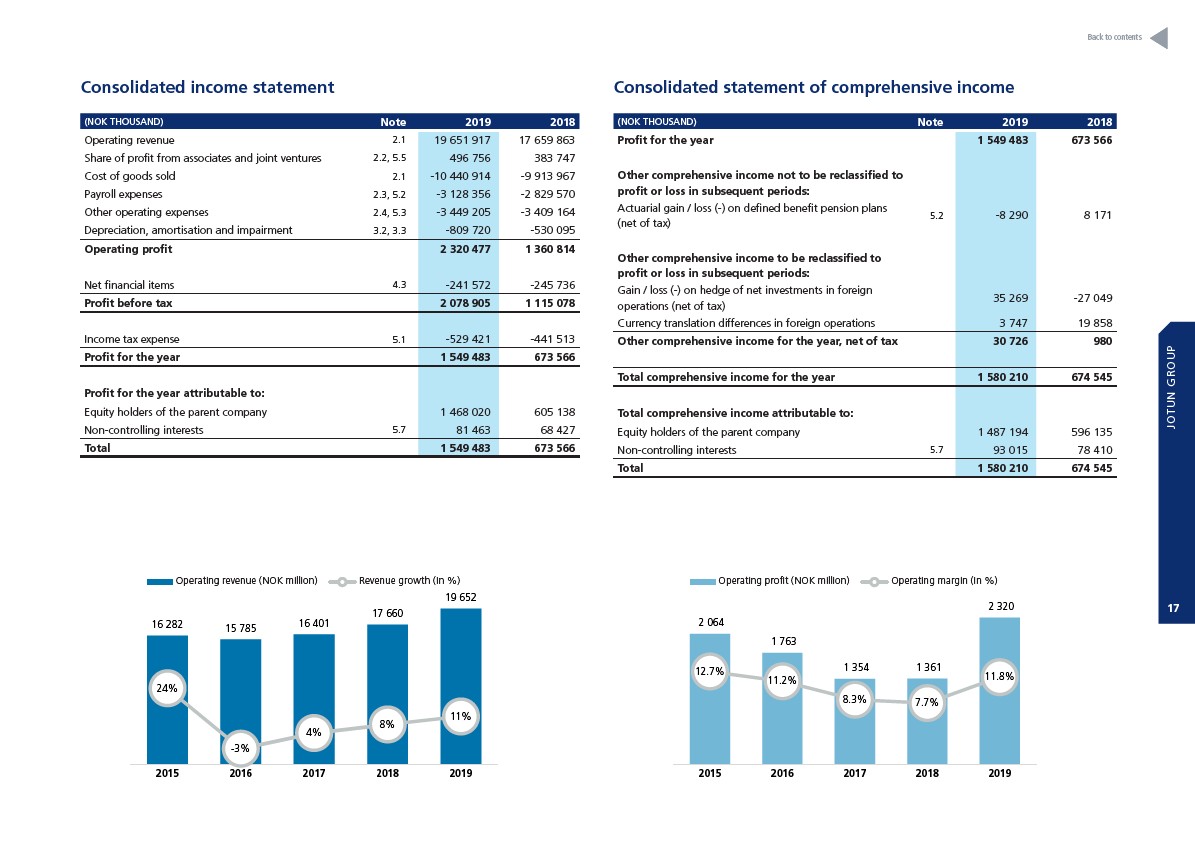
Consolidated income statement
(NOK THOUSAND) Note 2019 2018
Operating revenue 2.1 19 651 917 17 659 863
Share of profit from associates and joint ventures 2.2, 5.5 496 756 383 747
Cost of goods sold 2.1 -10 440 914 -9 913 967
Payroll expenses 2.3, 5.2 -3 128 356 -2 829 570
Other operating expenses 2.4, 5.3 -3 449 205 -3 409 164
Depreciation, amortisation and impairment 3.2, 3.3 -809 720 -530 095
Operating profit 2 320 477 1 360 814
Net financial items 4.3 -241 572 -245 736
Profit before tax 2 078 905 1 115 078
Income tax expense 5.1 -529 421 -441 513
Profit for the year 1 549 483 673 566
Profit for the year attributable to:
Equity holders of the parent company 1 468 020 605 138
Non-controlling interests 5.7 81 463 68 427
Total 1 549 483 673 566
Consolidated statement of comprehensive income
(NOK THOUSAND) Note 2019 2018
Profit for the year 1 549 483 673 566
Other comprehensive income not to be reclassified to
profit or loss in subsequent periods:
Actuarial gain / loss (-) on defined benefit pension plans
(net of tax)
5.2 -8 290 8 171
Other comprehensive income to be reclassified to
profit or loss in subsequent
periods:
Gain / loss (-) on hedge of net investments in foreign
operations (net of tax)
60%
Operating Revenue (NOK million) Revenue growth (In %)
35 269 -27 049
50%
20 000
Currency translation differences in foreign operations 3 747 19 858
40%
Other comprehensive income for the year, net of tax 30 726 980
30%
20%
15 000
10 000
Total comprehensive income for the year 1 580 210 674 545
10%
5 000
Total comprehensive income attributable to:
Equity holders of the parent company 1 487 194 596 135
Non-controlling interests 5.7 93 015 78 410
Total 1 580 210 674 545
Operating Revenue (NOK million) Revenue growth (In %)
16 282 15 785 16 401
17 660
19 652
24%
-3%
4%
8%
11%
60%
50%
40%
30%
20%
10%
0%
-10%
20 000
15 000
10 000
5 000
0
2015 2016 2017 2018 2019
16 282 15 785 16 401
17 660
19 652
24%
-3%
4%
8%
11%
0%
-10%
0
2015 2016 2017 2018 2019
Operating Profit (NOK million) Operating Margin (In %)
2 064
1 763
1 354 1 361
2 320
12.7%
11.2%
8.3% 7.7%
11.8%
23,0%
18,0%
13,0%
8,0%
3,0%
-2,0%
2 500
2 000
1 500
1 000
500
-
2015 2016 2017 2018 2019
Operating revenue (NOK million) Revenue growth (In %) Operating profit (NOK million) Operating margin (In %)
Back to contents
JOTUN GROUP
17