5.9 Details of financial assets and liabilities
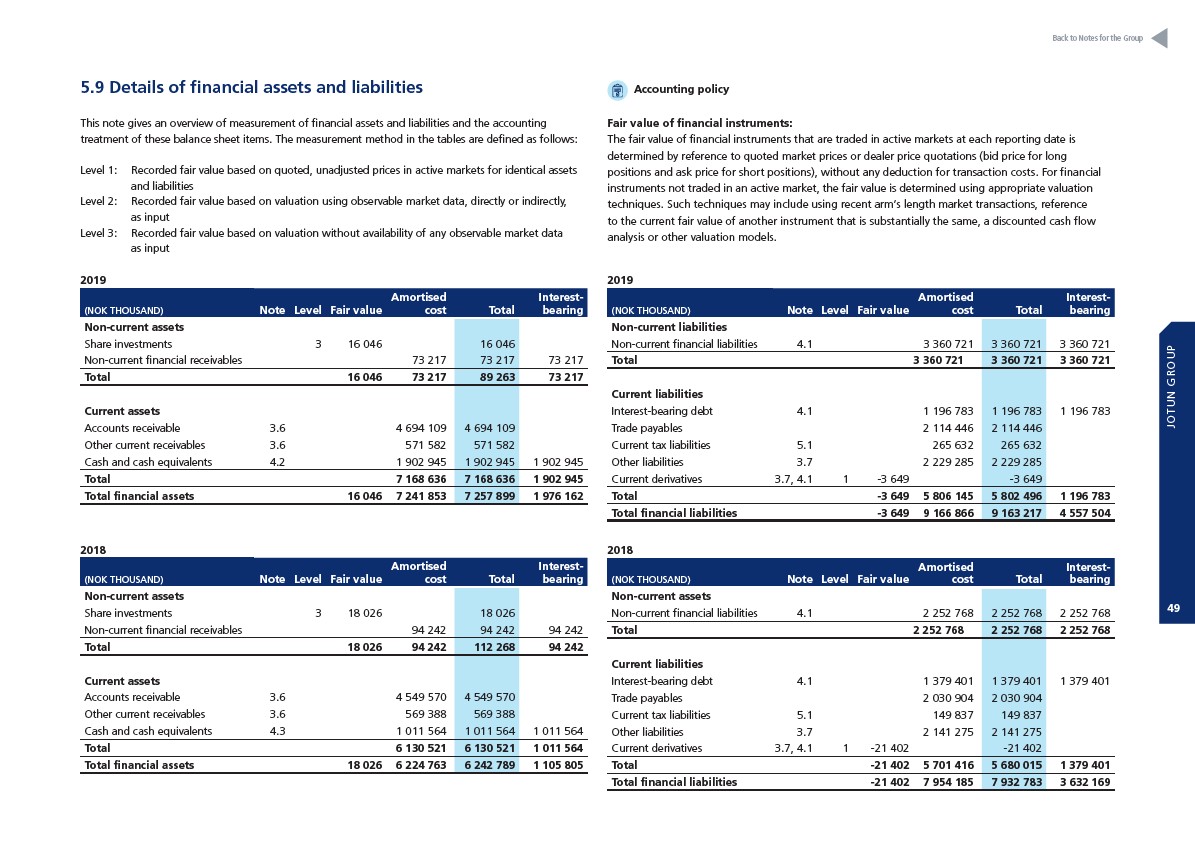
This note gives an overview of measurement of financial assets and liabilities and the accounting
treatment of these balance sheet items. The measurement method in the tables are defined as follows:
Level 1: Recorded fair value based on quoted, unadjusted prices in active markets for identical assets
and liabilities
Level 2: Recorded fair value based on valuation using observable market data, directly or indirectly,
as input
Level 3: Recorded fair value based on valuation without availability of any observable market data
as input
2019
(NOK THOUSAND) Note Level Fair value
Amortised
cost Total
Interest-
bearing
Non-current assets
Share investments 3 16 046 16 046
Non-current financial receivables 73 217 73 217 73 217
Total 16 046 73 217 89 263 73 217
Current assets
Accounts receivable 3.6 4 694 109 4 694 109
Other current receivables 3.6 571 582 571 582
Cash and cash equivalents 4.2 1 902 945 1 902 945 1 902 945
Total 7 168 636 7 168 636 1 902 945
Total financial assets 16 046 7 241 853 7 257 899 1 976 162
2018
(NOK THOUSAND) Note Level Fair value
Amortised
cost Total
Interest-
bearing
Non-current assets
Share investments 3 18 026 18 026
Non-current financial receivables 94 242 94 242 94 242
Total 18 026 94 242 112 268 94 242
Current assets
Accounts receivable 3.6 4 549 570 4 549 570
Other current receivables 3.6 569 388 569 388
Cash and cash equivalents 4.3 1 011 564 1 011 564 1 011 564
Total 6 130 521 6 130 521 1 011 564
Total financial assets 18 026 6 224 763 6 242 789 1 105 805
Accounting policy
Back to Notes for the Group
Fair value of financial instruments:
The fair value of financial instruments that are traded in active markets at each reporting date is
determined by reference to quoted market prices or dealer price quotations (bid price for long
positions and ask price for short positions), without any deduction for transaction costs. For financial
instruments not traded in an active market, the fair value is determined using appropriate valuation
techniques. Such techniques may include using recent arm’s length market transactions, reference
to the current fair value of another instrument that is substantially the same, a discounted cash flow
analysis or other valuation models.
2019
(NOK THOUSAND) Note Level Fair value
Non-current liabilities
Non-current financial liabilities 4.1 3 360 721 3 360 721 3 360 721
Total 3 360 721 3 360 721 3 360 721
Current liabilities
Interest-bearing debt 4.1 1 196 783 1 196 783 1 196 783
Trade payables 2 114 446 2 114 446
Current tax liabilities 5.1 265 632 265 632
Other liabilities 3.7 2 229 285 2 229 285
Current derivatives 3.7, 4.1 1 -3 649 -3 649
Total -3 649 5 806 145 5 802 496 1 196 783
Total financial liabilities -3 649 9 166 866 9 163 217 4 557 504
2018
(NOK THOUSAND) Note Level Fair value
Amortised
cost Total
Amortised
cost Total
Interest-
bearing
Interest-
bearing
Non-current assets
Non-current financial liabilities 4.1 2 252 768 2 252 768 2 252 768
Total 2 252 768 2 252 768 2 252 768
Current liabilities
Interest-bearing debt 4.1 1 379 401 1 379 401 1 379 401
Trade payables 2 030 904 2 030 904
Current tax liabilities 5.1 149 837 149 837
Other liabilities 3.7 2 141 275 2 141 275
Current derivatives 3.7, 4.1 1 -21 402 -21 402
Total -21 402 5 701 416 5 680 015 1 379 401
Total financial liabilities -21 402 7 954 185 7 932 783 3 632 169
JOTUN GROUP
49