(NOK THOUSAND) Note 31.12.2019 31.12.2018 Change
Inventories 3.5 2 829 761 2 840 690 -10 929
Accounts receivable 3.6 4 694 109 4 549 587 144 522
Trade payables 5.9 -2 114 446 -2 030 904 -83 542
Operating working capital 5 409 424 5 359 374 50 051
Bank drafts 3.6 149 411 111 653 37 758
Other receivables 3.6 422 171 457 718 -35 547
Public charges and holiday pay 3.7 -288 626 -280 965 -7 661
Other accrued expenses 3.7 -1 054 445 -1 046 183 -8 262
Current provisions 3.7, 3.8 -369 636 -514 924 145 289
Other working capital -1 141 125 -1 272 702 131 577
Net working capital 4 268 299 4 086 672 181 628
Intangible assets 3.2 712 441 523 310 189 131
Property, plant and equipment 3.3 6 489 083 5 288 252 1 200 831
Investments in associates and joint ventures 3.4 1 485 922 1 532 513 -46 592
Non-current provisions 3.8 -273 776 -40 673 -233 103
Pension liabilities 5.2 -220 651 -197 688 -22 963
Other non-current liabilities -45 638 -36 690 -8 948
Invested capital 8 147 380 7 069 024 1 078 356
Capital employed 12 415 680 11 155 696 1 259 984
Net deferred tax 5.1 322 579 249 541 73 038
Tax payable 5.1 -265 632 -149 837 -115 795
Share investments 5.9 16 046 18 026 -1 980
Prepaid dividend from associates and joint ventures 3.7 -323 124 -277 800 -45 325
Other invested capital -250 131 -160 069 -90 061
Invested capital and working capital items 12 165 549 10 995 626 1 169 923
Net interest-bearing debt 4.1 -2 581 342 -2 526 364 -54 979
Total equity 9 584 207 8 469 264 1 114 943
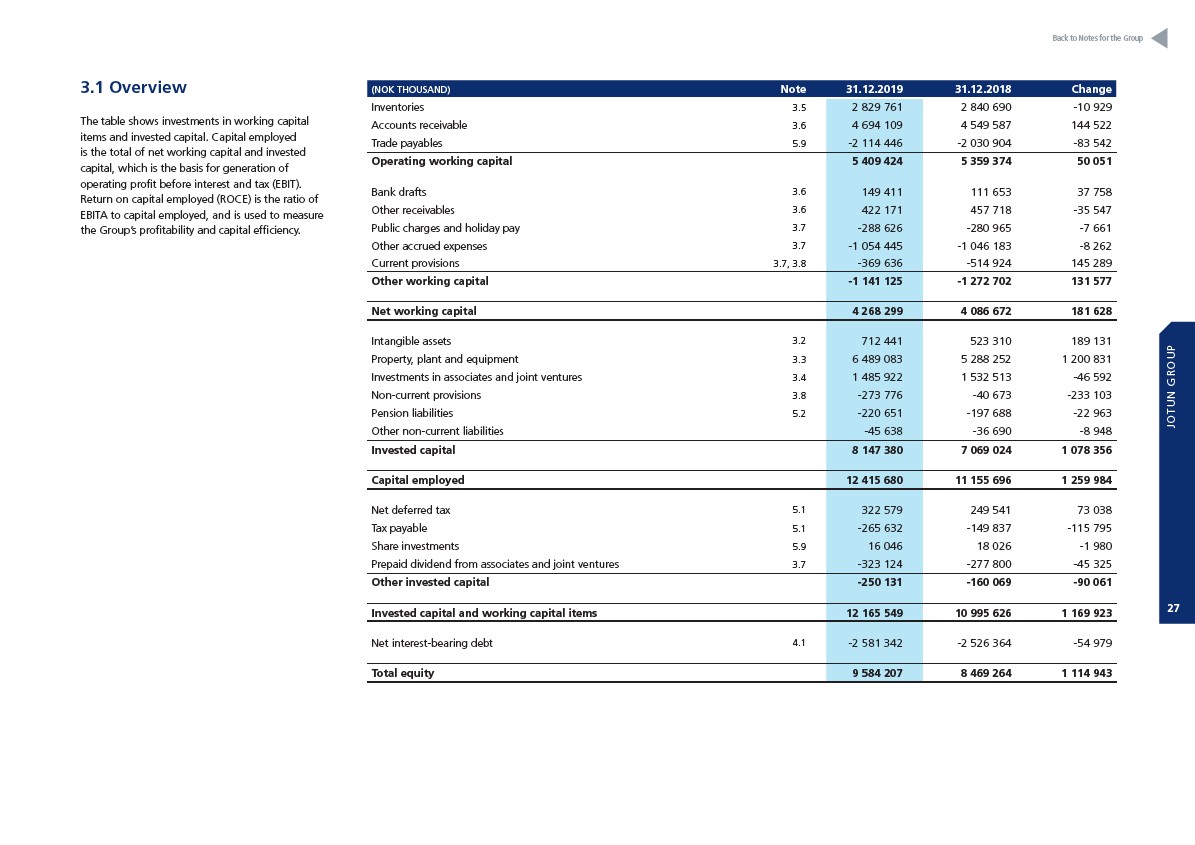
3.1 Overview
The table shows investments in working capital
items and invested capital. Capital employed
is the total of net working capital and invested
capital, which is the basis for generation of
operating profit before interest and tax (EBIT).
Return on capital employed (ROCE) is the ratio of
EBITA to capital employed, and is used to measure
the Group’s profitability and capital efficiency.
Back to Notes for the Group
JOTUN GROUP
27