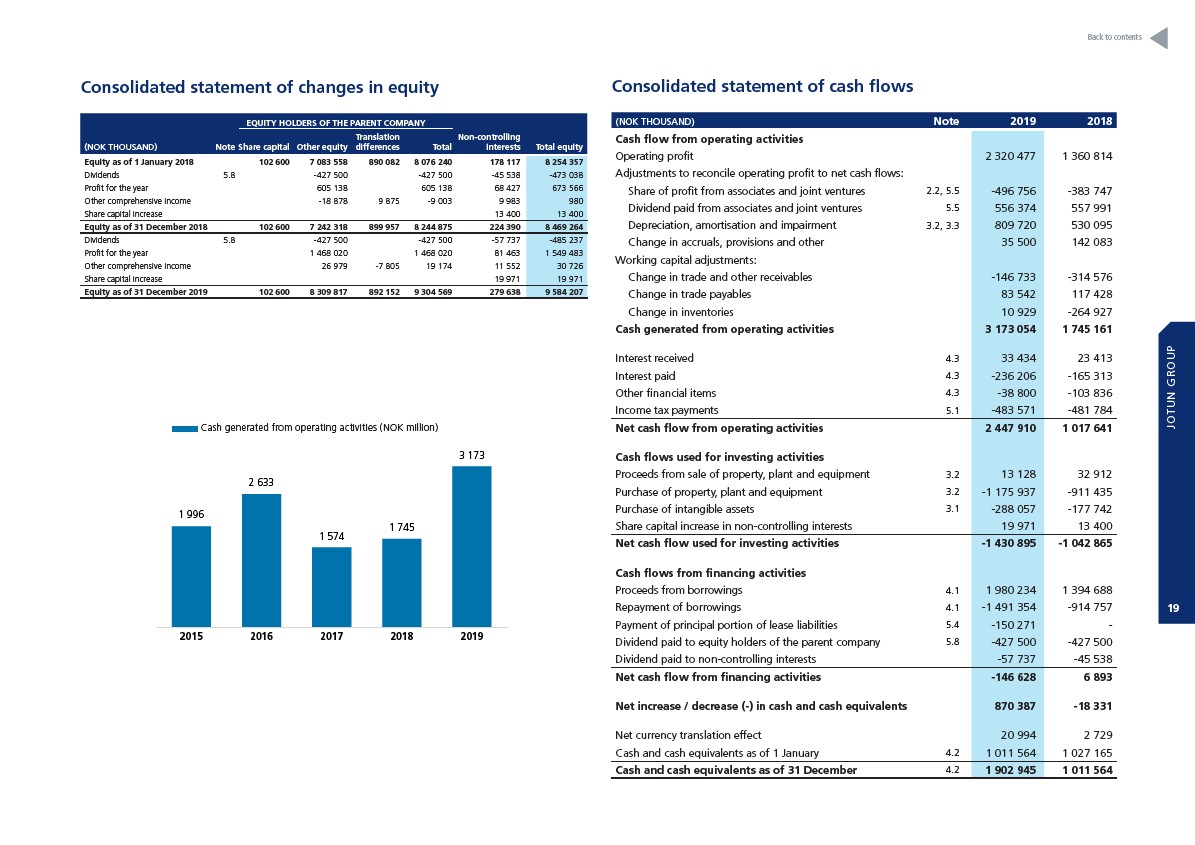
Consolidated statement of changes in equity
Operating Profit (NOK million) Operating Margin (In %)
EQUITY HOLDERS OF THE PARENT COMPANY
2 064
2 500
(NOK THOUSAND) Note Share capital Other equity
Translation
differences Total
23,0%
Non-controlling
interests Total equity
18,0%
2 000
Equity as of 1 January 2018 1 763
102 600 7 083 558 890 082 8 076 240 178 117 8 254 357
Dividends 5.8 -427 500 -427 500 -45 538 -473 038
Profit for the year 1 605 354 138 1 361
605 138 68 427 673 566
Other comprehensive income -18 878 9 875 -9 003 9 983 980
Share capital increase 13 400 13 400
Equity as of 31 December 2018 102 600 7 242 318 899 957 8 244 875 224 390 8 469 264
Dividends 5.8 -427 500 -427 500 -57 737 -485 237
Profit for the year 1 468 020 1 468 020 81 463 1 549 483
Other comprehensive income 26 979 -7 805 19 174 11 552 30 726
Share capital increase 19 971 19 971
Equity as of 31 December 2019 102 600 8 309 817 892 152 9 304 569 279 638 9 584 207
2 320
12.7%
11.2%
8.3% 7.7%
11.8%
13,0%
8,0%
3,0%
-2,0%
1 500
1 000
500
-
2015 2016 2017 2018 2019
Cash generated from operating activities (NOK million)
1 996
2 633
1 574
1 745
3 173
3 500
3 000
2 500
2 000
1 500
1 000
500
0
2015 2016 2017 2018 2019
Consolidated statement of cash flows
(NOK THOUSAND) Note 2019 2018
Cash flow from operating activities
Operating profit 2 320 477 1 360 814
Adjustments to reconcile operating profit to net cash flows:
Share of profit from associates and joint ventures 2.2, 5.5 -496 756 -383 747
Dividend paid from associates and joint ventures 5.5 556 374 557 991
Depreciation, amortisation and impairment 3.2, 3.3 809 720 530 095
Change in accruals, provisions and other 35 500 142 083
Working capital adjustments:
Change in trade and other receivables -146 733 -314 576
Change in trade payables 83 542 117 428
Change in inventories 10 929 -264 927
Cash generated from operating activities 3 173 054 1 745 161
Interest received 4.3 33 434 23 413
Interest paid 4.3 -236 206 -165 313
Other financial items 4.3 -38 800 -103 836
Income tax payments 5.1 -483 571 -481 784
Net cash flow from operating activities 2 447 910 1 017 641
Cash flows used for investing activities
Proceeds from sale of property, plant and equipment 3.2 13 128 32 912
Purchase of property, plant and equipment 3.2 -1 175 937 -911 435
Purchase of intangible assets 3.1 -288 057 -177 742
Share capital increase in non-controlling interests 19 971 13 400
Net cash flow used for investing activities -1 430 895 -1 042 865
Cash flows from financing activities
Proceeds from borrowings 4.1 1 980 234 1 394 688
Repayment of borrowings 4.1 -1 491 354 -914 757
Payment of principal portion of lease liabilities 5.4 -150 271 -
Dividend paid to equity holders of the parent company 5.8 -427 500 -427 500
Dividend paid to non-controlling interests -57 737 -45 538
Net cash flow from financing activities -146 628 6 893
Net increase / decrease (-) in cash and cash equivalents 870 387 -18 331
Net currency translation effect 20 994 2 729
Cash and cash equivalents as of 1 January 4.2 1 011 564 1 027 165
Cash and cash equivalents as of 31 December 4.2 1 902 945 1 011 564
from operating activities (NOK million)
Back to contents
JOTUN GROUP
19