Overview
31.12.19 31.12.18
(NOK THOUSAND) Associates
Joint
ventures Total Associates
Joint
ventures Total
Carrying amount 1 January 995 924 536 589 1 532 513 958 525 657 129 1 615 654
Share of profit and loss 430 623 66 132 496 756 404 954 -21 207 383 747
Exchange differences 15 409 -2 381 13 028 79 525 11 577 91 103
Dividend -556 374 - -556 374 -447 081 -110 910 -557 991
Carrying amount 31 December 885 581 600 341 1 485 922 995 924 536 589 1 532 513
Revenues 4 526 833 3 401 344 7 928 177 4 062 124 2 631 749 6 693 872
Revenues - Jotun entities* 587 299 1 146 424 1 733 724 599 231 923 226 1 522 457
Total revenues 5 114 132 4 547 769 9 661 901 4 661 355 3 554 974 8 216 329
Profit / (loss) for the year 1 010 748 132 265 1 143 013 956 428 -42 414 914 014
* Subsidiaries, associates and joint ventures.
Group’s investments (share of total equity) in associates and joint ventures:
Associates
The Group has the following investments in associates:
(NOK THOUSAND)
Jotun Saudia
Co. Ltd.
Jotun
Yemen
Paints Ltd.
Jotun U.A.E
Ltd. (LLC)
Jotun Abu
Dhabi Ltd.
(LLC)
Jotun Powder
Coatings Saudi
Arabia Co. Ltd.
Back to Notes for the Group
Jotun Powder
Coatings U.A.E.
Ltd. (LLC) Total
Country Saudi Arabia Yemen U.A.E. U.A.E. Saudi Arabia U.A.E.
Ownership interest 40.0 % 34.4 % 41.5 % 51.6 % 46.6 % 47.0 %
Carrying amount 1 January 386 475 -553 333 586 105 144 94 165 77 106 995 924
Net profit / (loss) during the year 169 006 - 163 188 57 530 5 368 35 531 430 623
Exchange differences 5 907 -8 6 678 1 176 1 064 592 15 409
Dividend -253 035 - -191 045 -54 323 -13 102 -44 870 -556 374
Carrying amount as of 31 December 308 353 -561 312 407 109 527 87 496 68 359 885 581
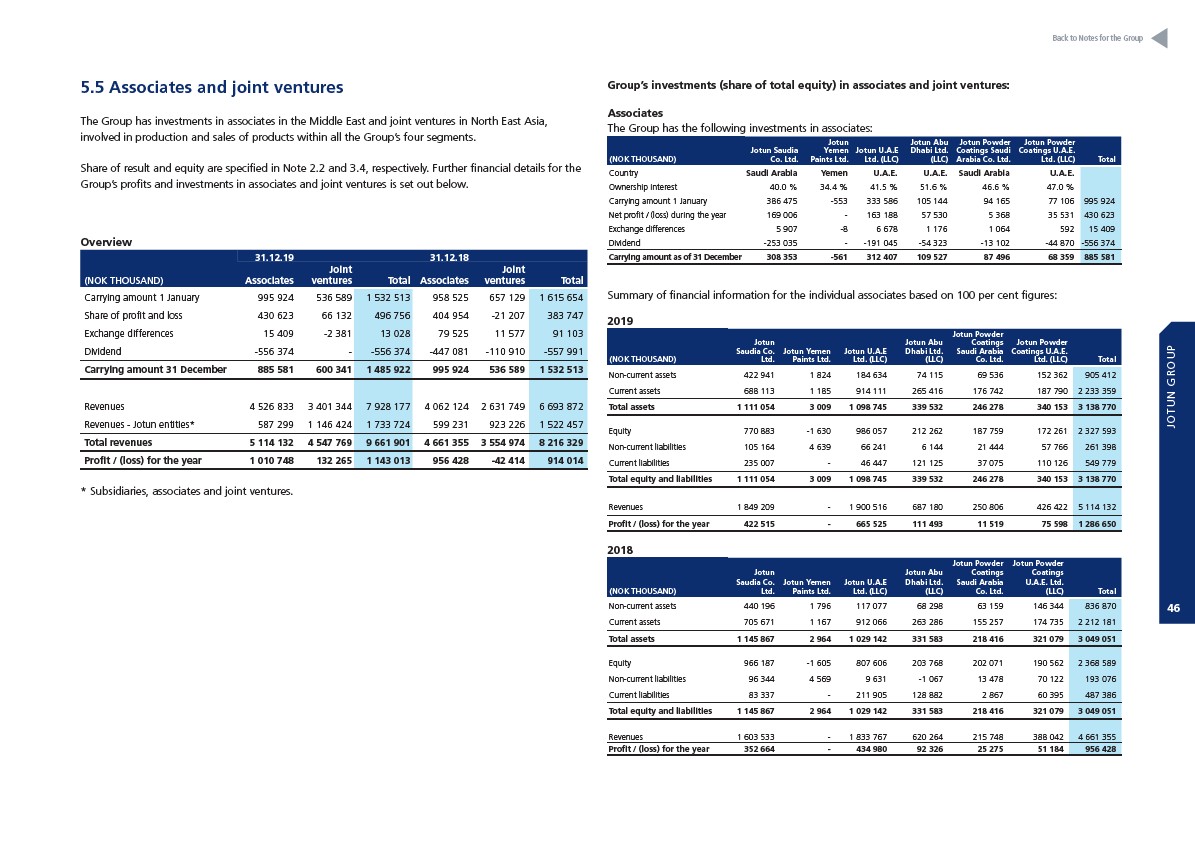
5.5 Associates and joint ventures
The Group has investments in associates in the Middle East and joint ventures in North East Asia,
involved in production and sales of products within all the Group’s four segments.
Share of result and equity are specified in Note 2.2 and 3.4, respectively. Further financial details for the
Group’s profits and investments in associates and joint ventures is set out below.
Summary of financial information for the individual associates based on 100 per cent figures:
2019
(NOK THOUSAND)
Jotun
Saudia Co.
Ltd.
Jotun Yemen
Paints Ltd.
Jotun U.A.E
Ltd. (LLC)
Jotun Abu
Dhabi Ltd.
(LLC)
Jotun Powder
Coatings
Saudi Arabia
Co. Ltd.
Jotun Powder
Coatings U.A.E.
Ltd. (LLC) Total
Non-current assets 422 941 1 824 184 634 74 115 69 536 152 362 905 412
Current assets 688 113 1 185 914 111 265 416 176 742 187 790 2 233 359
Total assets 1 111 054 3 009 1 098 745 339 532 246 278 340 153 3 138 770
Equity 770 883 -1 630 986 057 212 262 187 759 172 261 2 327 593
Non-current liabilities 105 164 4 639 66 241 6 144 21 444 57 766 261 398
Current liabilities 235 007 - 46 447 121 125 37 075 110 126 549 779
Total equity and liabilities 1 111 054 3 009 1 098 745 339 532 246 278 340 153 3 138 770
Revenues 1 849 209 - 1 900 516 687 180 250 806 426 422 5 114 132
Profit / (loss) for the year 422 515 - 665 525 111 493 11 519 75 598 1 286 650
2018
(NOK THOUSAND)
Jotun
Saudia Co.
Ltd.
Jotun Yemen
Paints Ltd.
Jotun U.A.E
Ltd. (LLC)
Jotun Abu
Dhabi Ltd.
(LLC)
Jotun Powder
Coatings
Saudi Arabia
Co. Ltd.
Jotun Powder
Coatings
U.A.E. Ltd.
(LLC) Total
Non-current assets 440 196 1 796 117 077 68 298 63 159 146 344 836 870
Current assets 705 671 1 167 912 066 263 286 155 257 174 735 2 212 181
Total assets 1 145 867 2 964 1 029 142 331 583 218 416 321 079 3 049 051
Equity 966 187 -1 605 807 606 203 768 202 071 190 562 2 368 589
Non-current liabilities 96 344 4 569 9 631 -1 067 13 478 70 122 193 076
Current liabilities 83 337 - 211 905 128 882 2 867 60 395 487 386
Total equity and liabilities 1 145 867 2 964 1 029 142 331 583 218 416 321 079 3 049 051
Revenues 1 603 533 - 1 833 767 620 264 215 748 388 042 4 661 355
Profit / (loss) for the year 352 664 - 434 980 92 326 25 275 51 184 956 428
JOTUN GROUP
46