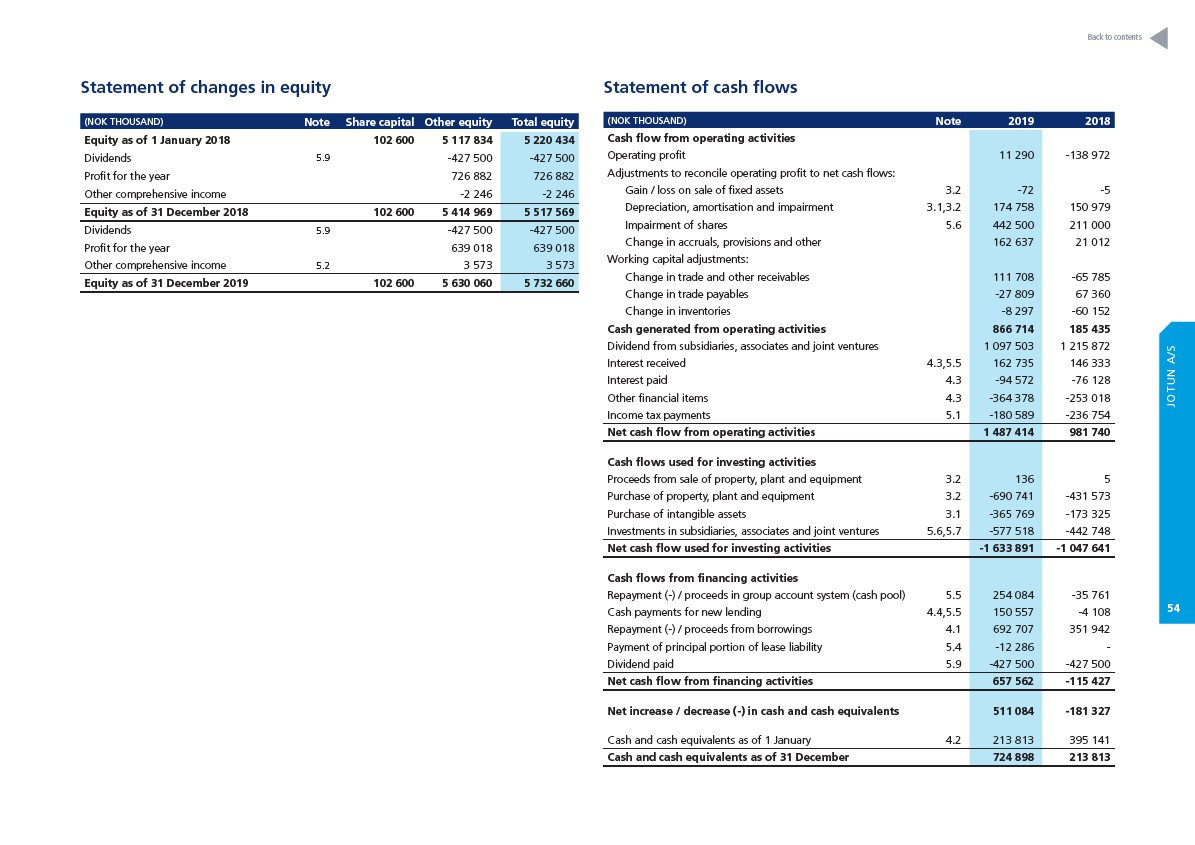
Statement of changes in equity
(NOK THOUSAND) Note Share capital Other equity Total equity
Equity as of 1 January 2018 102 600 5 117 834 5 220 434
Dividends 5.9 -427 500 -427 500
Profit for the year 726 882 726 882
Other comprehensive income -2 246 -2 246
Equity as of 31 December 2018 102 600 5 414 969 5 517 569
Dividends 5.9 -427 500 -427 500
Profit for the year 639 018 639 018
Other comprehensive income 5.2 3 573 3 573
Equity as of 31 December 2019 102 600 5 630 060 5 732 660
Statement of cash flows
Back to contents
(NOK THOUSAND) Note 2019 2018
Cash flow from operating activities
Operating profit 11 290 -138 972
Adjustments to reconcile operating profit to net cash flows:
Gain / loss on sale of fixed assets 3.2 -72 -5
Depreciation, amortisation and impairment 3.1,3.2 174 758 150 979
Impairment of shares 5.6 442 500 211 000
Change in accruals, provisions and other 162 637 21 012
Working capital adjustments:
Change in trade and other receivables 111 708 -65 785
Change in trade payables -27 809 67 360
Change in inventories -8 297 -60 152
Cash generated from operating activities 866 714 185 435
Dividend from subsidiaries, associates and joint ventures 1 097 503 1 215 872
Interest received 4.3,5.5 162 735 146 333
Interest paid 4.3 -94 572 -76 128
Other financial items 4.3 -364 378 -253 018
Income tax payments 5.1 -180 589 -236 754
Net cash flow from operating activities 1 487 414 981 740
Cash flows used for investing activities
Proceeds from sale of property, plant and equipment 3.2 136 5
Purchase of property, plant and equipment 3.2 -690 741 -431 573
Purchase of intangible assets 3.1 -365 769 -173 325
Investments in subsidiaries, associates and joint ventures 5.6,5.7 -577 518 -442 748
Net cash flow used for investing activities -1 633 891 -1 047 641
Cash flows from financing activities
Repayment (-) / proceeds in group account system (cash pool) 5.5 254 084 -35 761
Cash payments for new lending 4.4,5.5 150 557 -4 108
Repayment (-) / proceeds from borrowings 4.1 692 707 351 942
Payment of principal portion of lease liability 5.4 -12 286 -
Dividend paid 5.9 -427 500 -427 500
Net cash flow from financing activities 657 562 -115 427
Net increase / decrease (-) in cash and cash equivalents 511 084 -181 327
Cash and cash equivalents as of 1 January 4.2 213 813 395 141
Cash and cash equivalents as of 31 December 724 898 213 813
JOTUN A/S
54