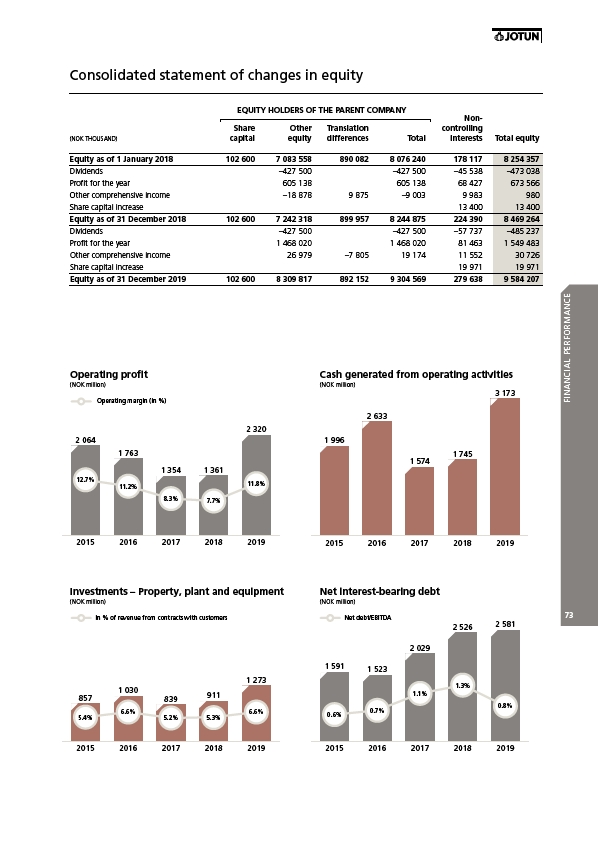
Consolidated statement of changes in equity
EQUITY HOLDERS OF THE PARENT COMPANY
Non-
Share Other Translation controlling
(NOK THOUSAND) capital equity differences Total interests Total equity
Equity as of 1 January 2018 102 600 7 083 558 890 082 8 076 240 178 117 8 254 357
Dividends –427 500 –427 500 –45 538 –473 038
Profit for the year 605 138 605 138 68 427 673 566
Other comprehensive income –18 878 9 875 –9 003 9 983 980
Share capital increase 13 400 13 400
Equity as of 31 December 2018 102 600 7 242 318 899 957 8 244 875 224 390 8 469 264
Dividends –427 500 –427 500 –57 737 –485 237
Profit for the year 1 468 020 1 468 020 81 463 1 549 483
Other comprehensive income 26 979 –7 805 19 174 11 552 30 726
Share capital increase 19 971 19 971
Equity as of 31 December 2019 102 600 8 309 817 892 152 9 304 569 279 638 9 584 207
1 996
2015
2 633
2016
1 574
2017
1 745
2018
3 173
2019
FINANCIAL PERFORMANCE
73
Cash generated from operating activities
(NOK million)
Operating profit
(NOK million)
Net interest-bearing debt
(NOK million)
Operating margin (in %)
Operating margin (in %)
2 064
2 064
12.7%
12.7%
2015
2015
1 763
1 763
11.2%
11.2%
2016
2016
1 354
1 354
8.3%
8.3%
2017
2017
1 361
1 361
7.7%
7.7%
2018
2018
2 320
2 320
11.8%
11.8%
2019
2019
Investments – Property, plant and equipment
(NOK million)
857
5.4%
2015
1 030
6.6%
2016
839
5.2%
2017
911
5.3%
2018
1 273
6.6%
2019
In % of revenue from contracts with customers
1 591
0.6%
2015
1 523
0.7%
2016
2 029
1.1%
2017
2 526
1.3%
2018
2 581
0.8%
2019
Net debt/EBITDA