OUR BUSINESS
10
Jotun finished 2019 with all all-time high profits and sales growth in all regions.
Jotun’s excellent performance in 2019 was driven by significant
growth in the Marine and Protective Coatings segments
and strong profitability in the Decorative Paints segment,
despite lower growth. Higher gross margins were driven by
the successful implementation of price increases and the
stabilisation of raw material costs. The company was also
rewarded for its efforts to control manageable costs.
Market recovery
After some difficult years in the Marine Coatings segment,
Jotun has been successful in capturing a large share of the
newbuilding market (especially in South Korea) and has seen
good growth in the maintenance and repair markets with its
DryDock and SeaStock concepts. In the Protective Coatings
segment, Jotun has benefitted from growth in demand in the
Offshore concept and continues to increase its market share
in the Infrastructure, Energy and the Hydrocarbon Processing
Industry (HPI) concepts. And despite some challenges in key
markets in the first half of the year, the Decorative Paints
segment ended 2019 at an all-time high.
Jotun is working to improve results. For example, despite all
the hard work and dedication of personnel in the Powder
Coatings segment, Jotun’s growth and profitability did not
meet expectations. Another focus area is customer credit and
Days Sales Outstanding (DSO). In 2019, Jotun met targets
for reducing DSO, resulting in improved working capital.
The company will continue to work to further improve credit
management in the years ahead.
Investing in the future
Jotun anticipates that growth will continue in 2020. While
results may be impacted by political or economic instability in
some regions and ongoing effects of global trade disputes, the
company’s segment and regional diversity helps to mitigate
risk. In addition, Jotun’s continued investments and upgrades
in production capacity (Vietnam, Egypt) and Research and
Development facilities (the UAE, Norway) will put Jotun in a
strong position to stay profitable and grow volumes in the future.
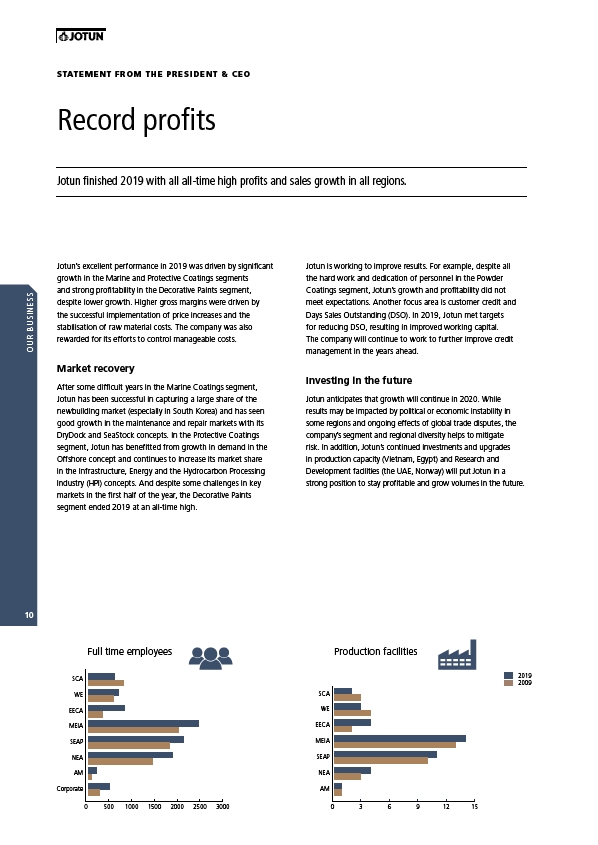
3 6 9 12 15
SCA
WE
EECA
MEIA
SEAP
NEA
AM
0
Production facilities
SCA
WE
EECA
MEIA
SEAP
NEA
AM
Corporate
Full time employees
0 500 1000 1500 2000 2500 3000
2019
2009
STATEMENT FROM THE PRESIDENT & CEO
Record profits